AI Car Training Analysis
Comprehensive visualization of neural network evolution across generations
Weight Evolution Heatmap
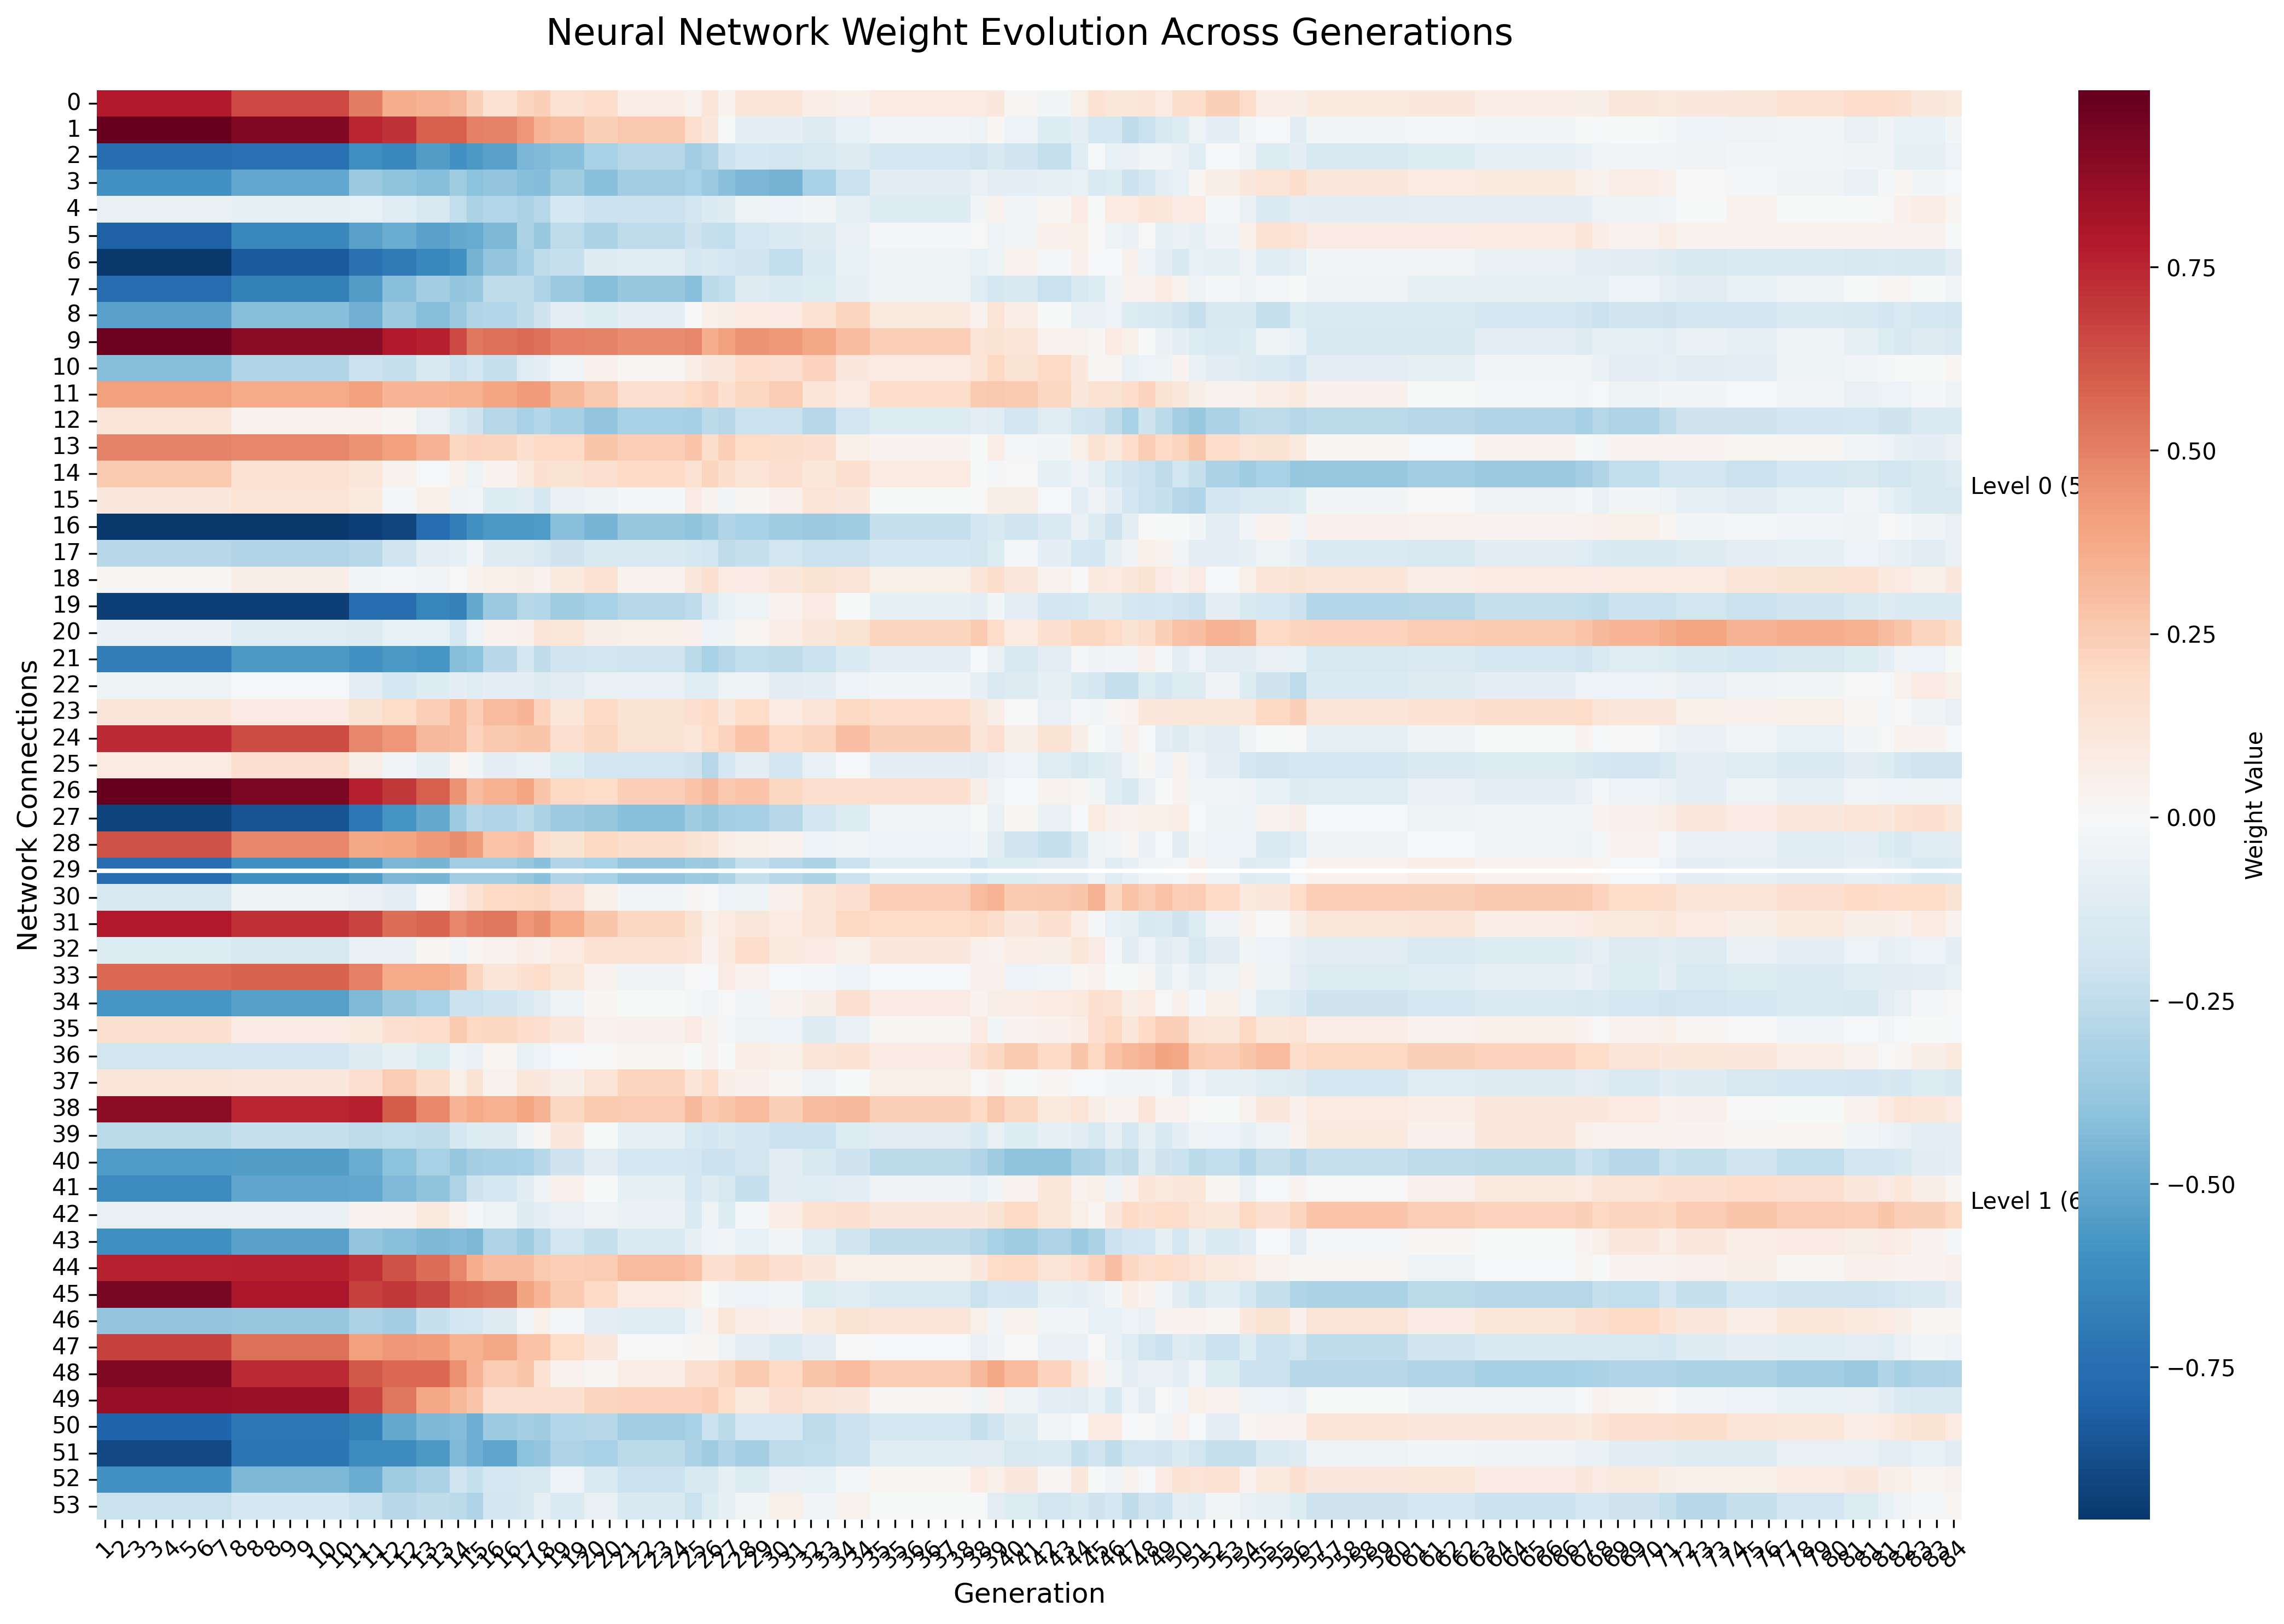
Shows how neural network weights changed across generations. Darker areas indicate stable connections, while bright areas show active learning.
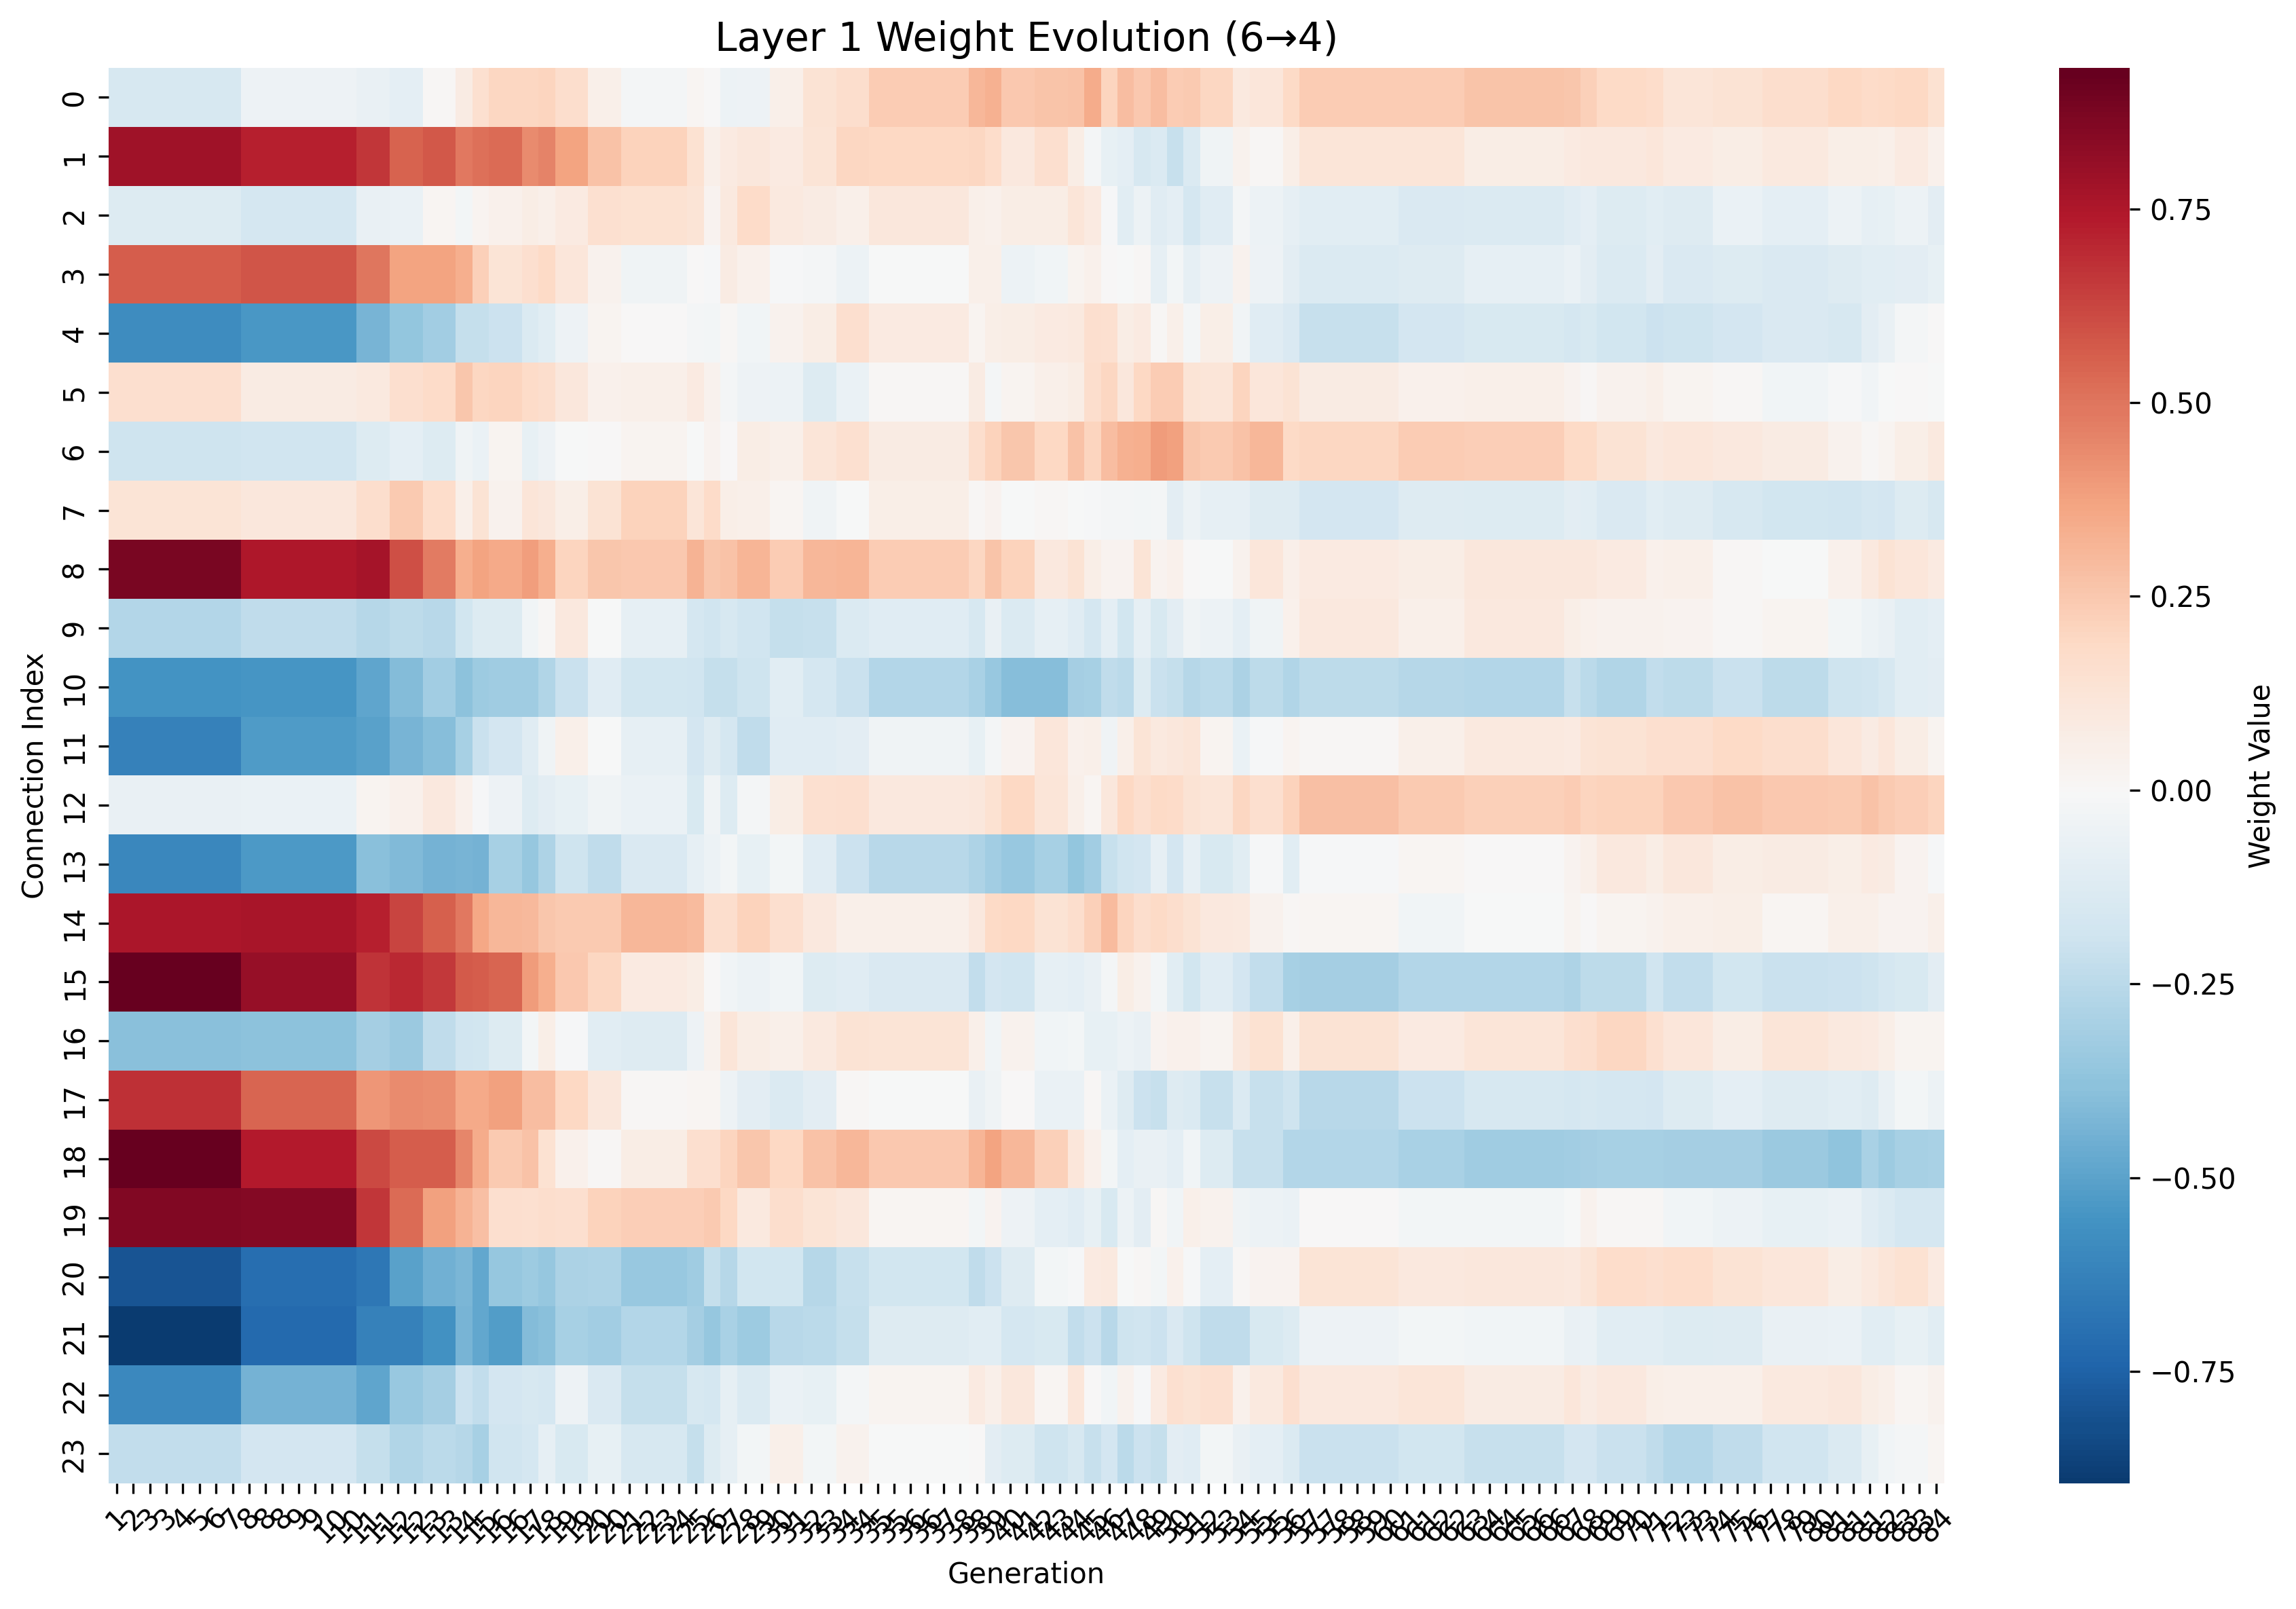
Layer-Specific Changes
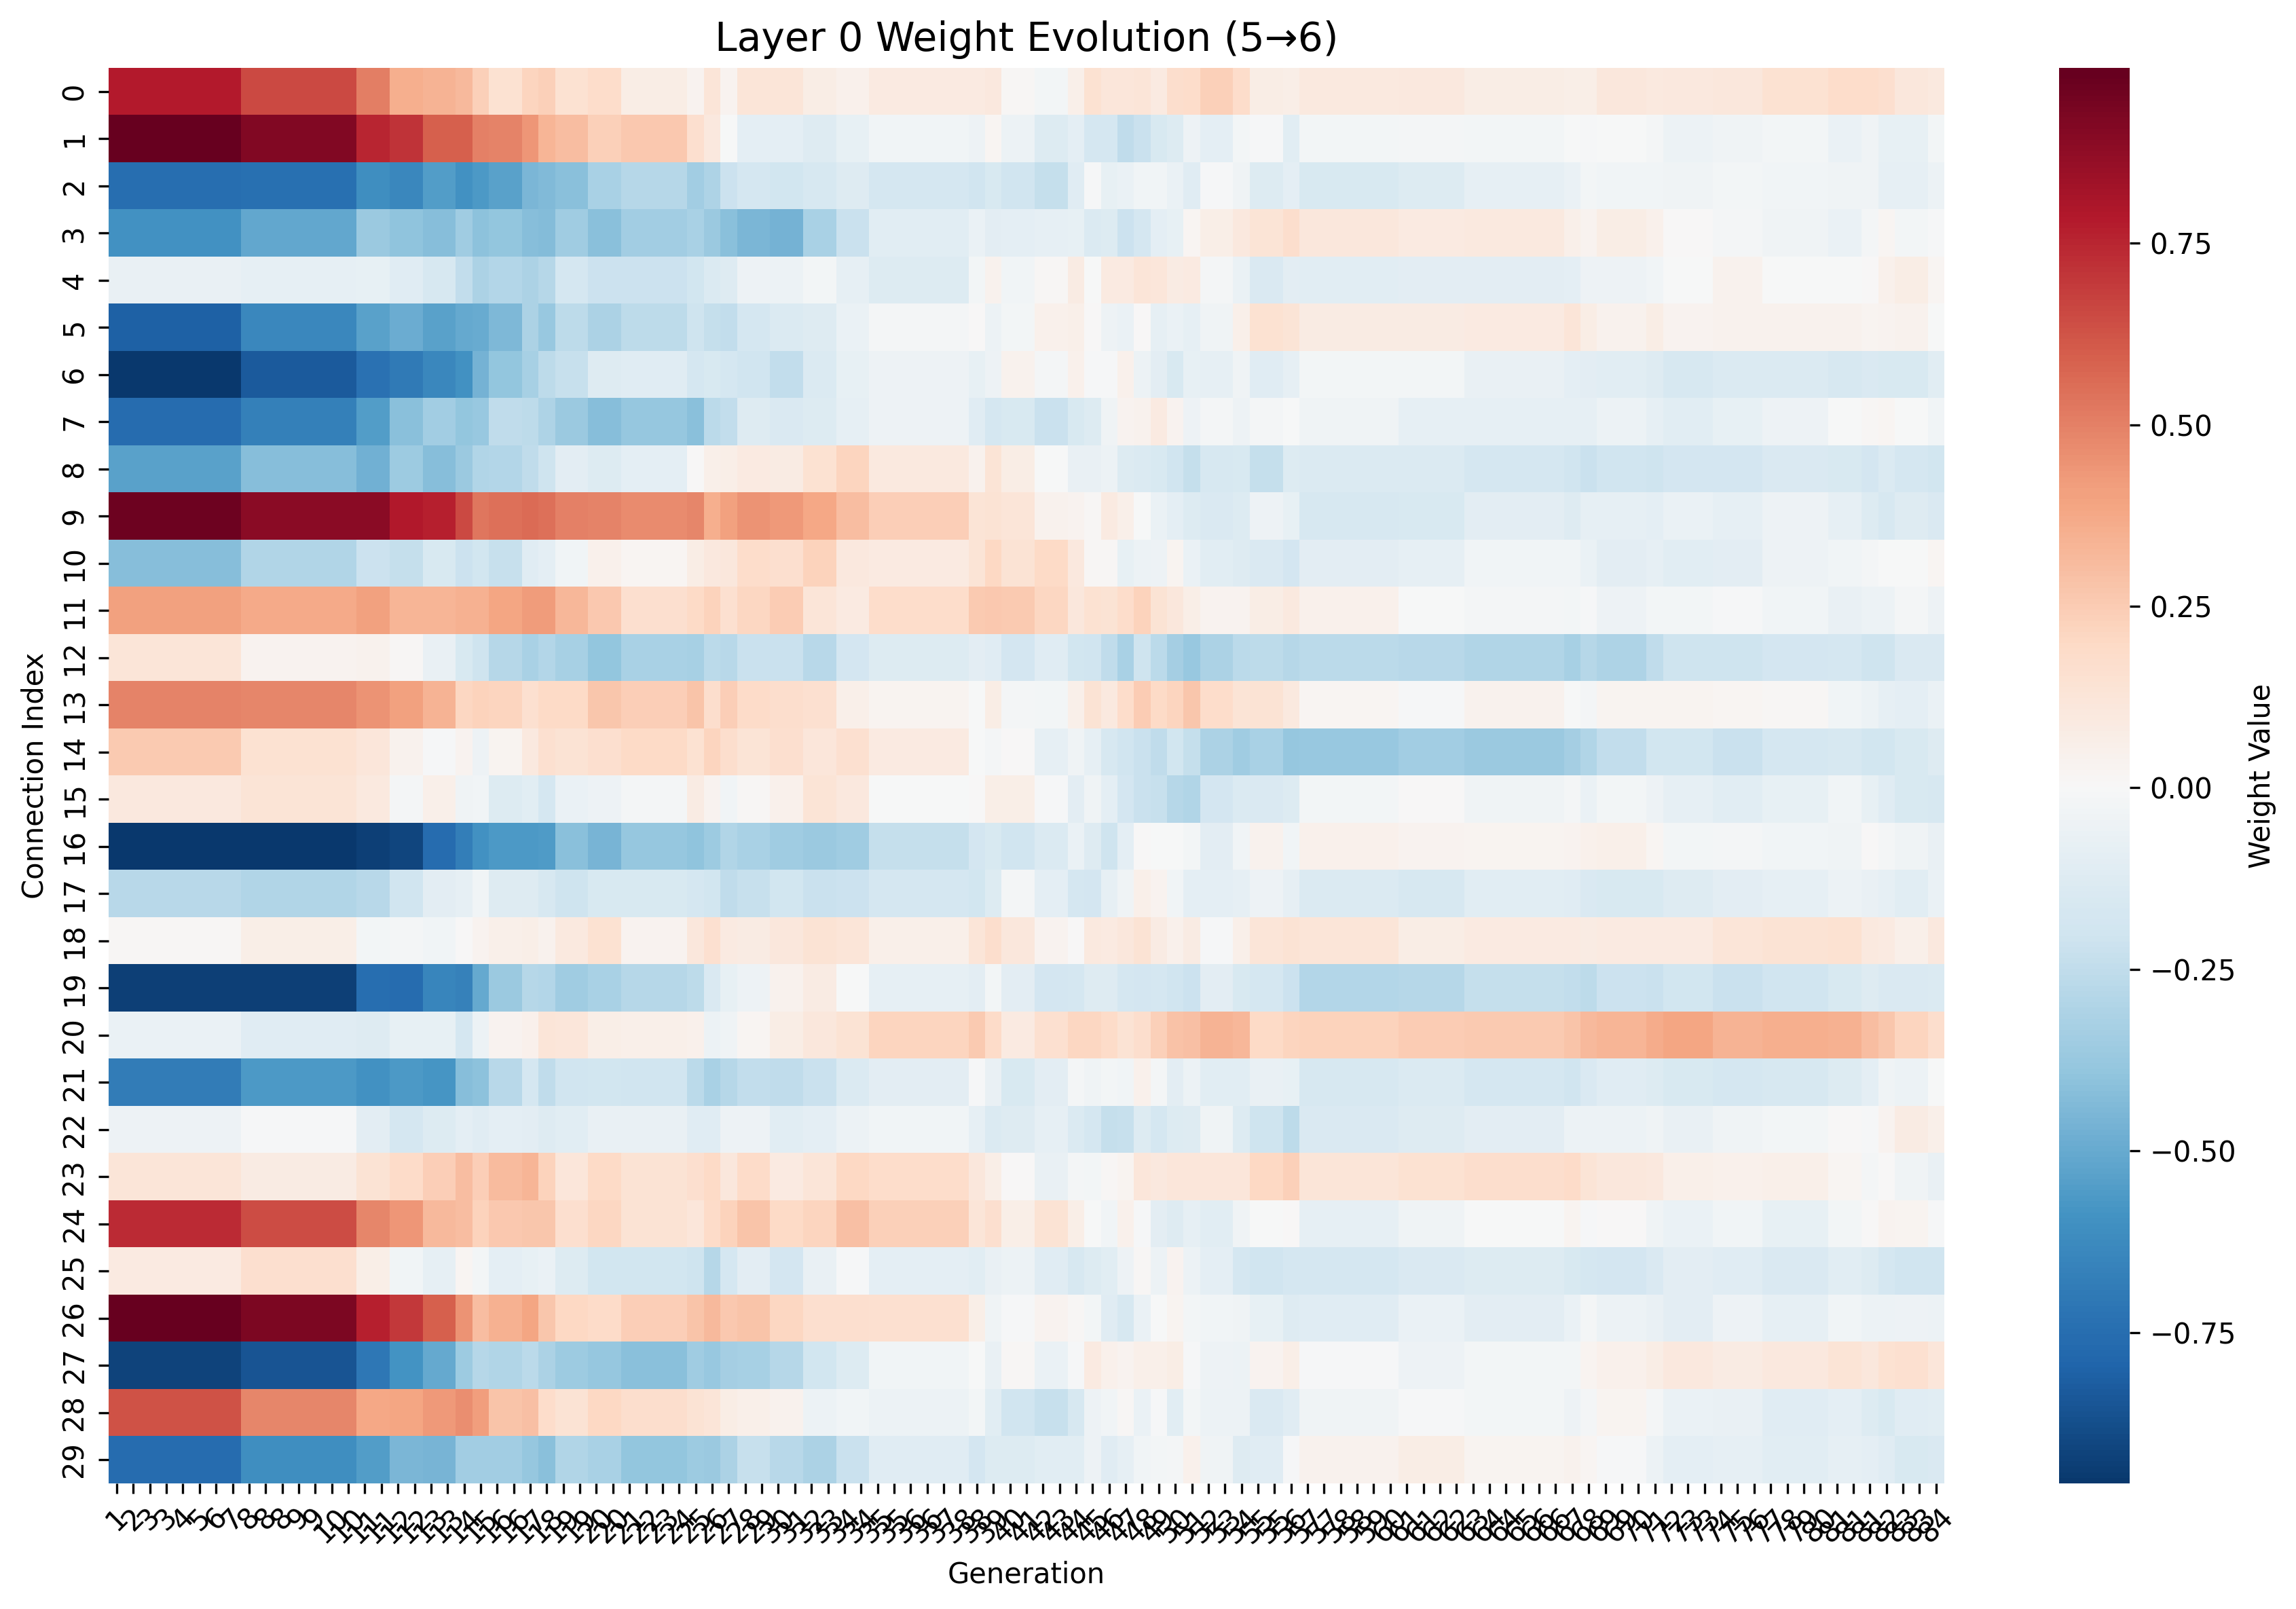
Individual analysis of each neural network layer, revealing which parts of the brain adapted most during training.
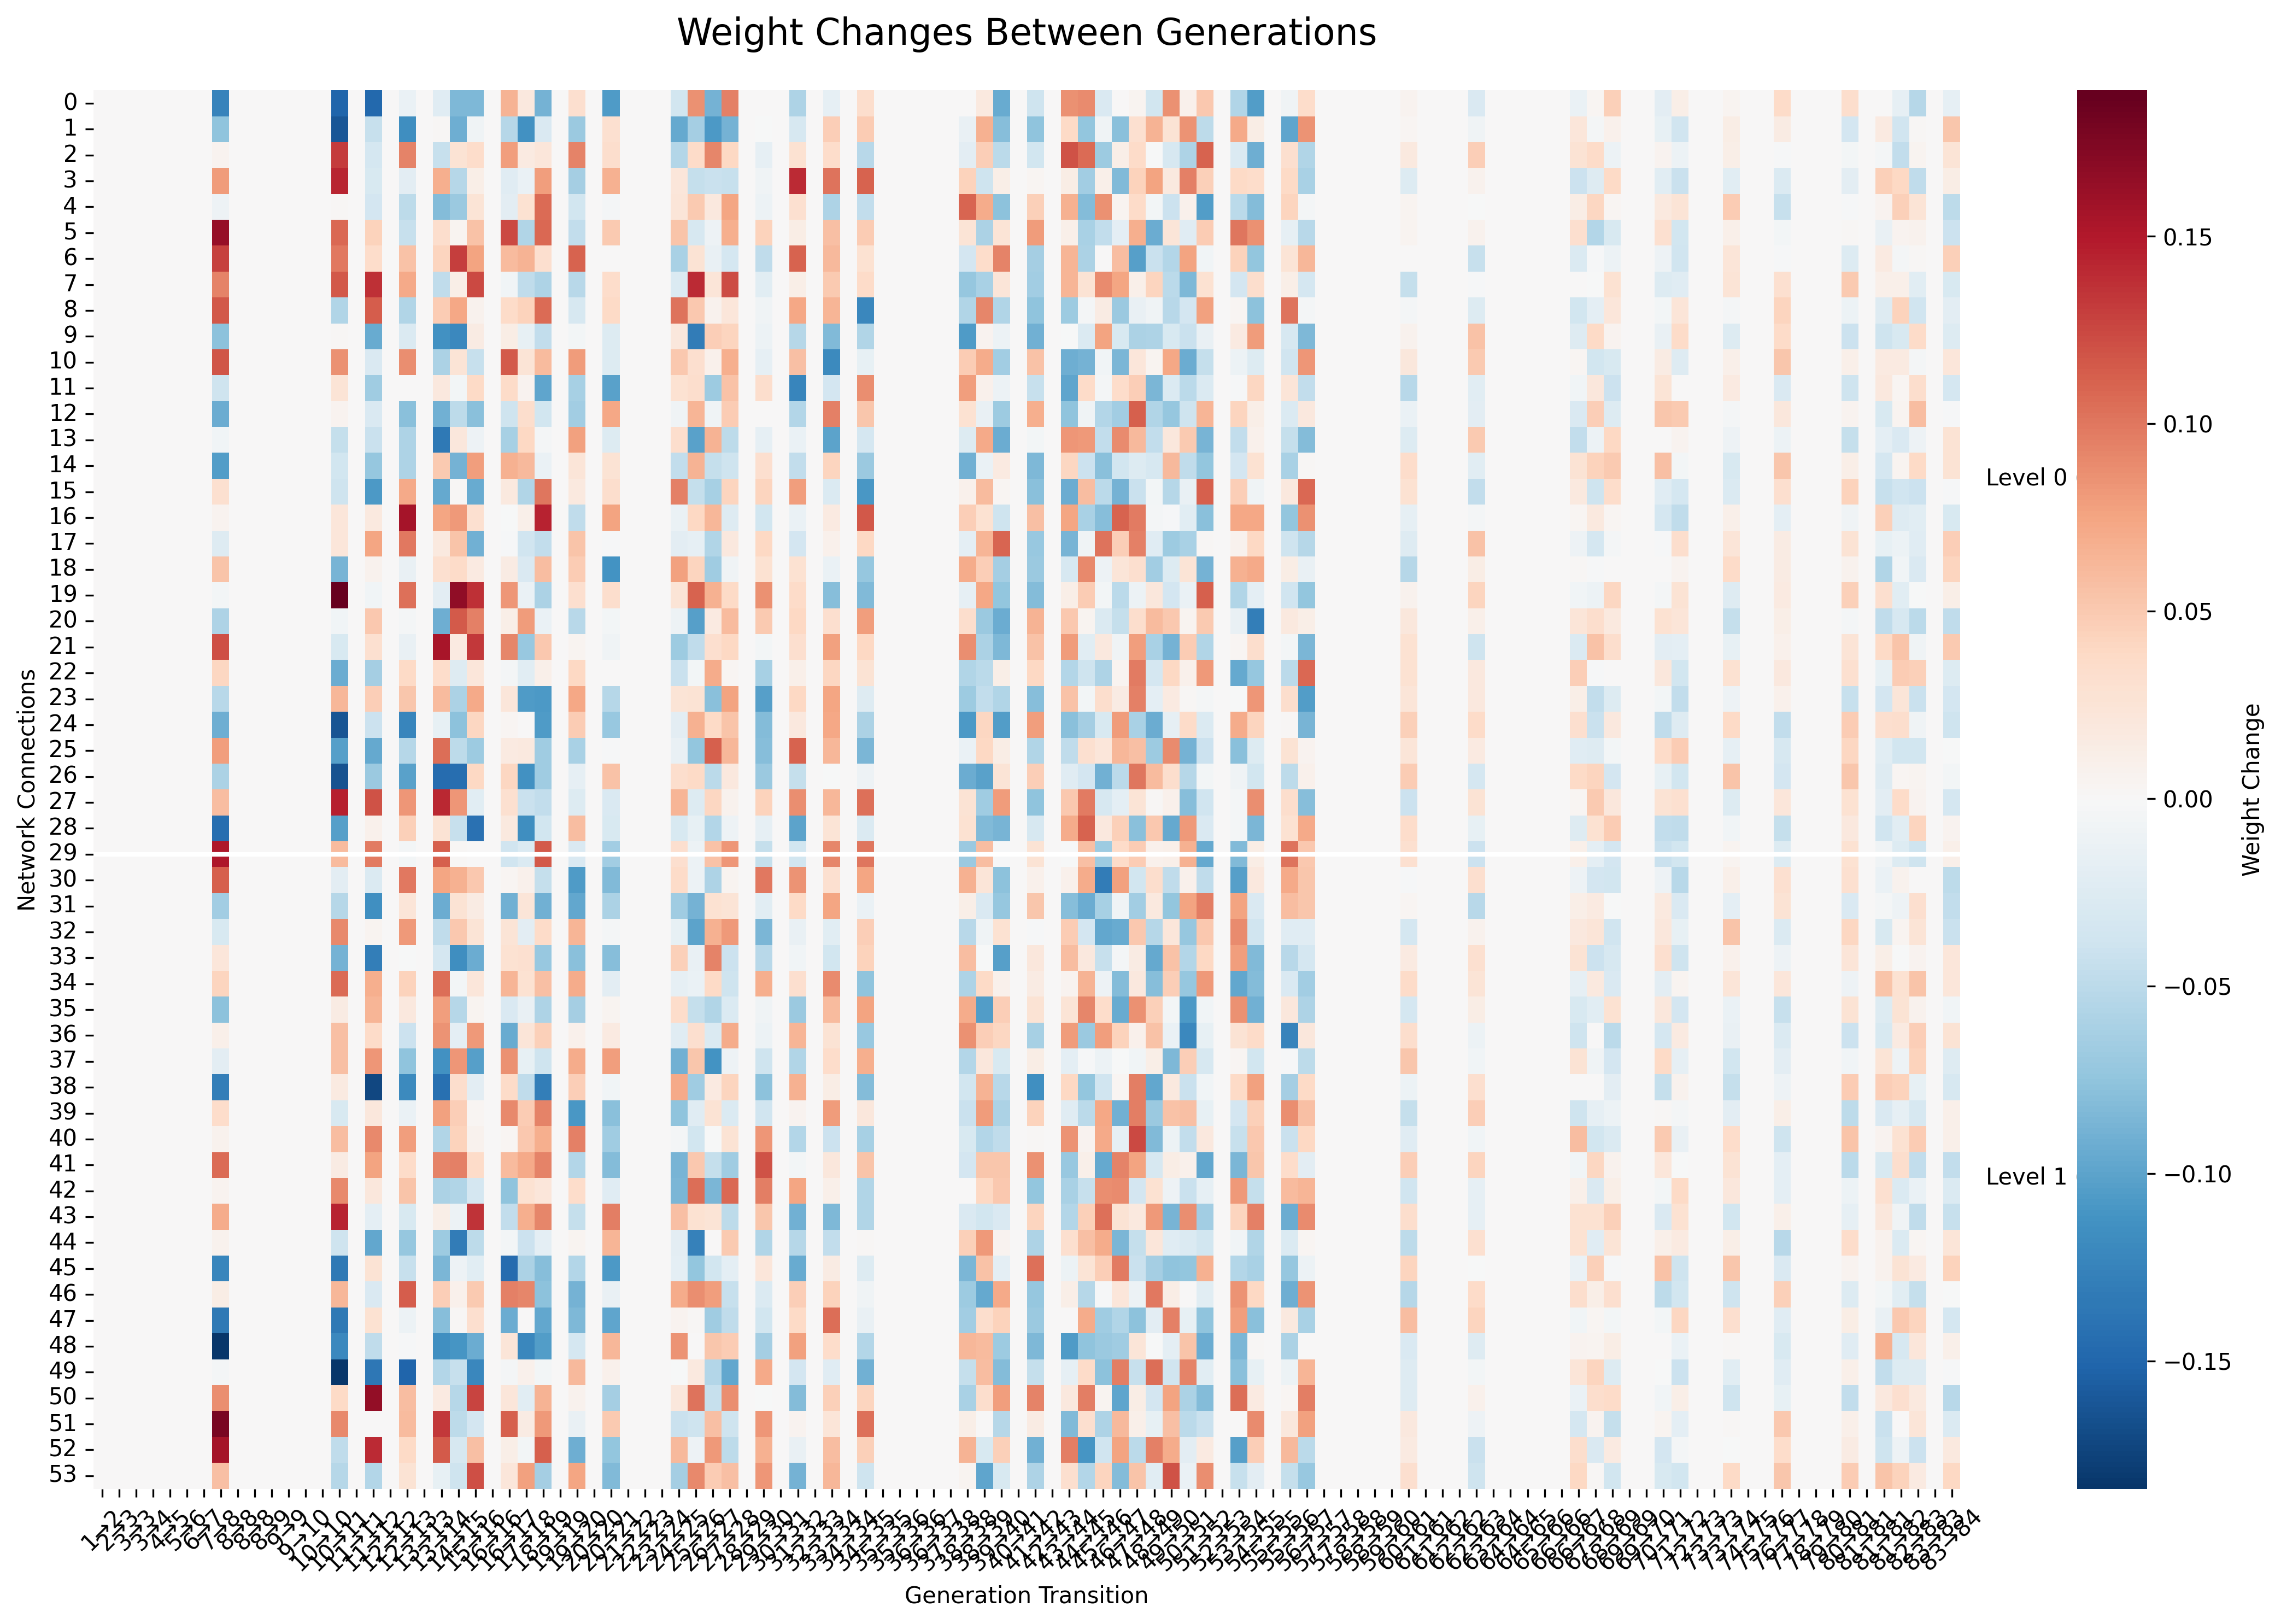
Weight Change Timeline
Timeline view showing when major neural adaptations occurred, highlighting critical learning moments.
Weight Change Timeline
Timeline view showing when major neural adaptations occurred, highlighting critical learning moments.
Decision Patterns Radar
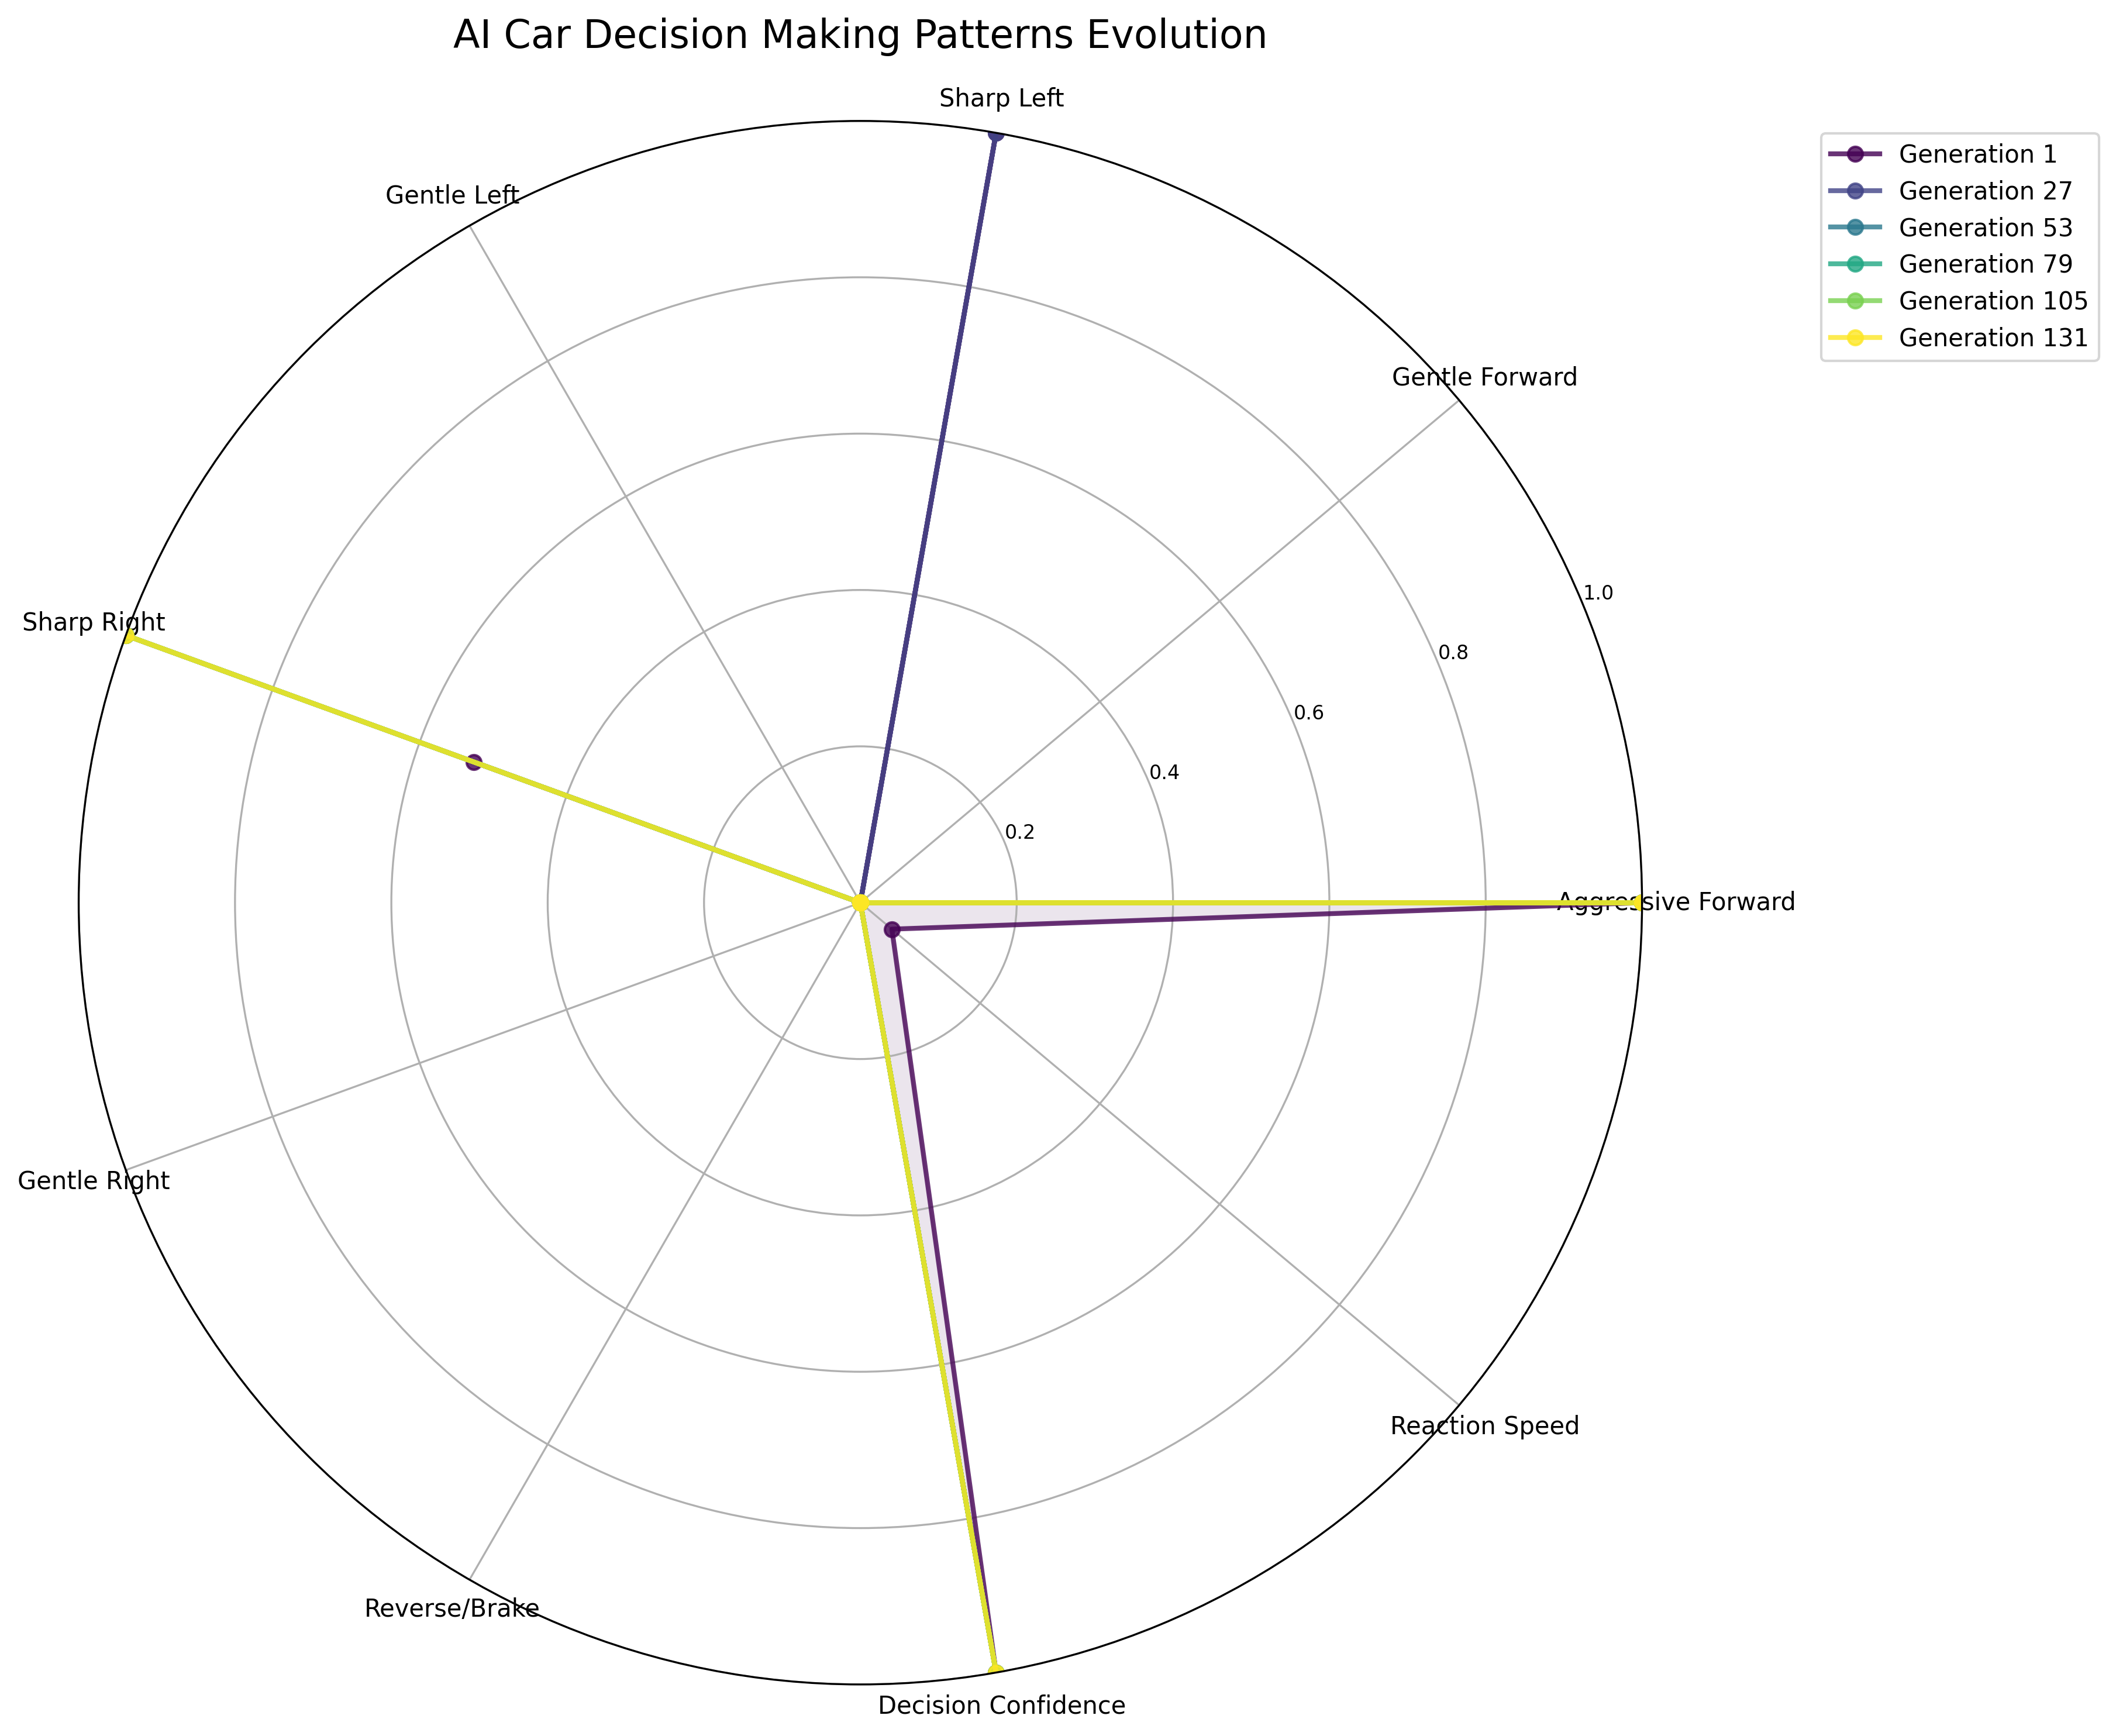
Radar chart showing how the AI's decision-making patterns evolved across different driving scenarios.
Behavioral Evolution Timeline
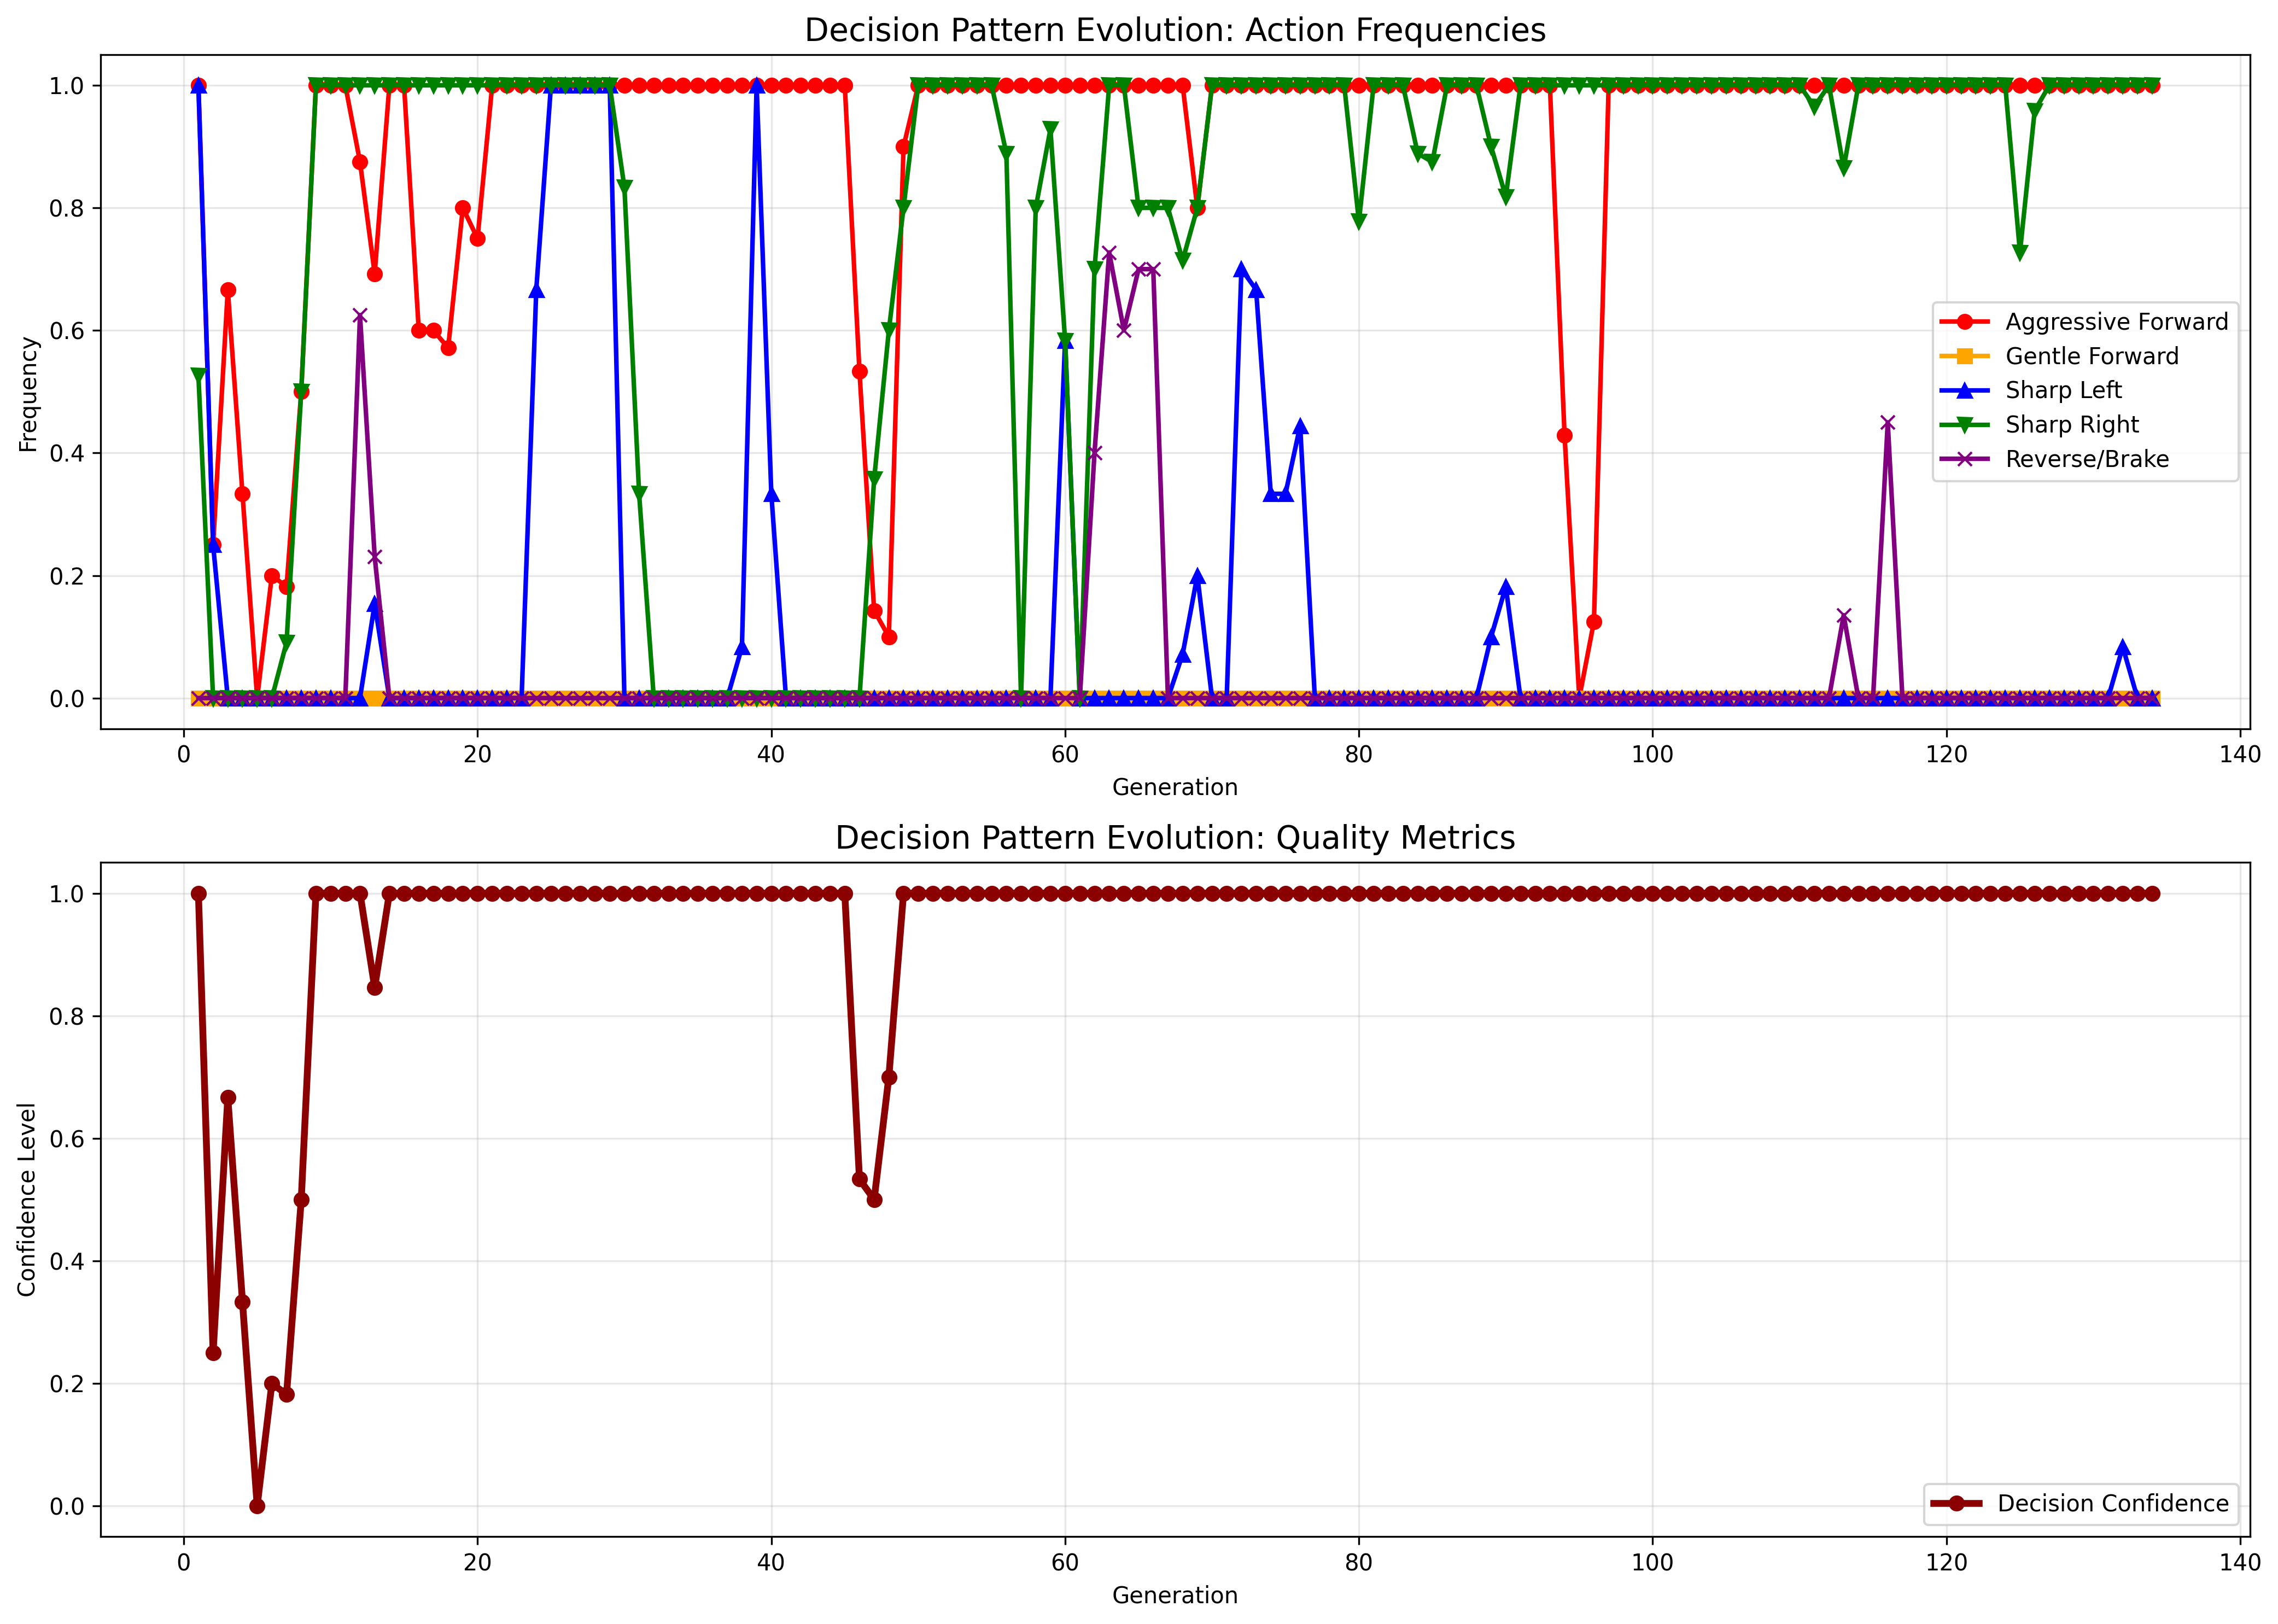
Timeline of behavioral changes, showing when the AI learned specific driving behaviors like cornering and speed control.
Behavioral Comparison
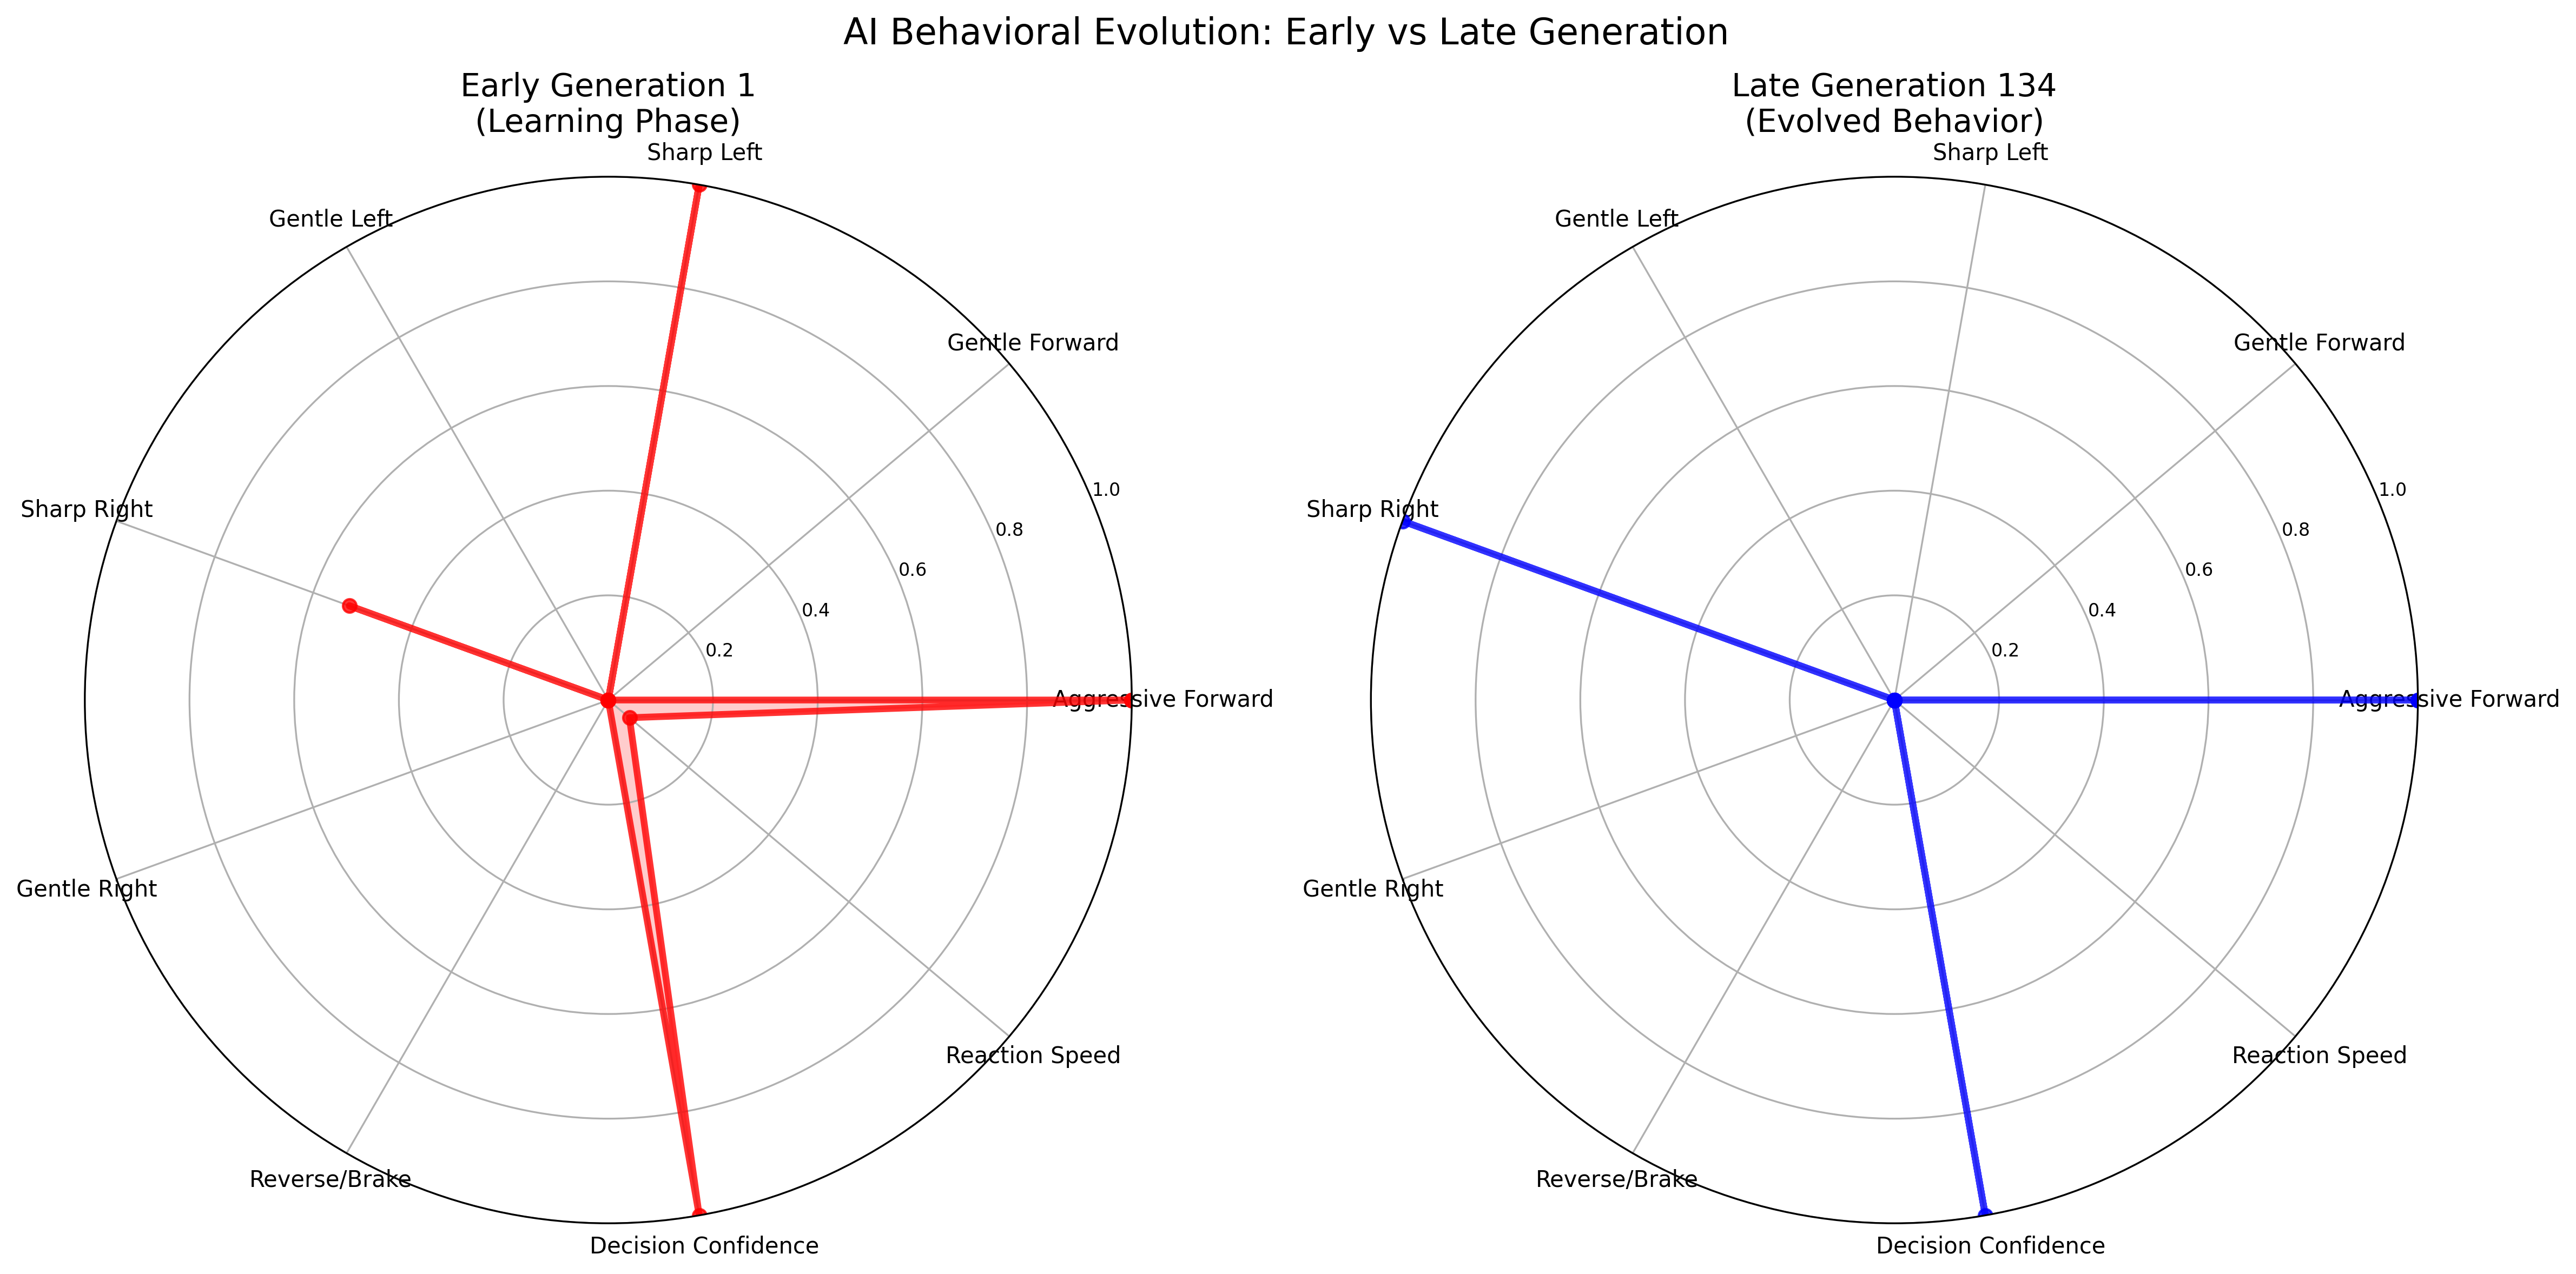
Side-by-side comparison of driving behaviors between early chaotic generations and later optimized ones.
Mutation Impact Analysis
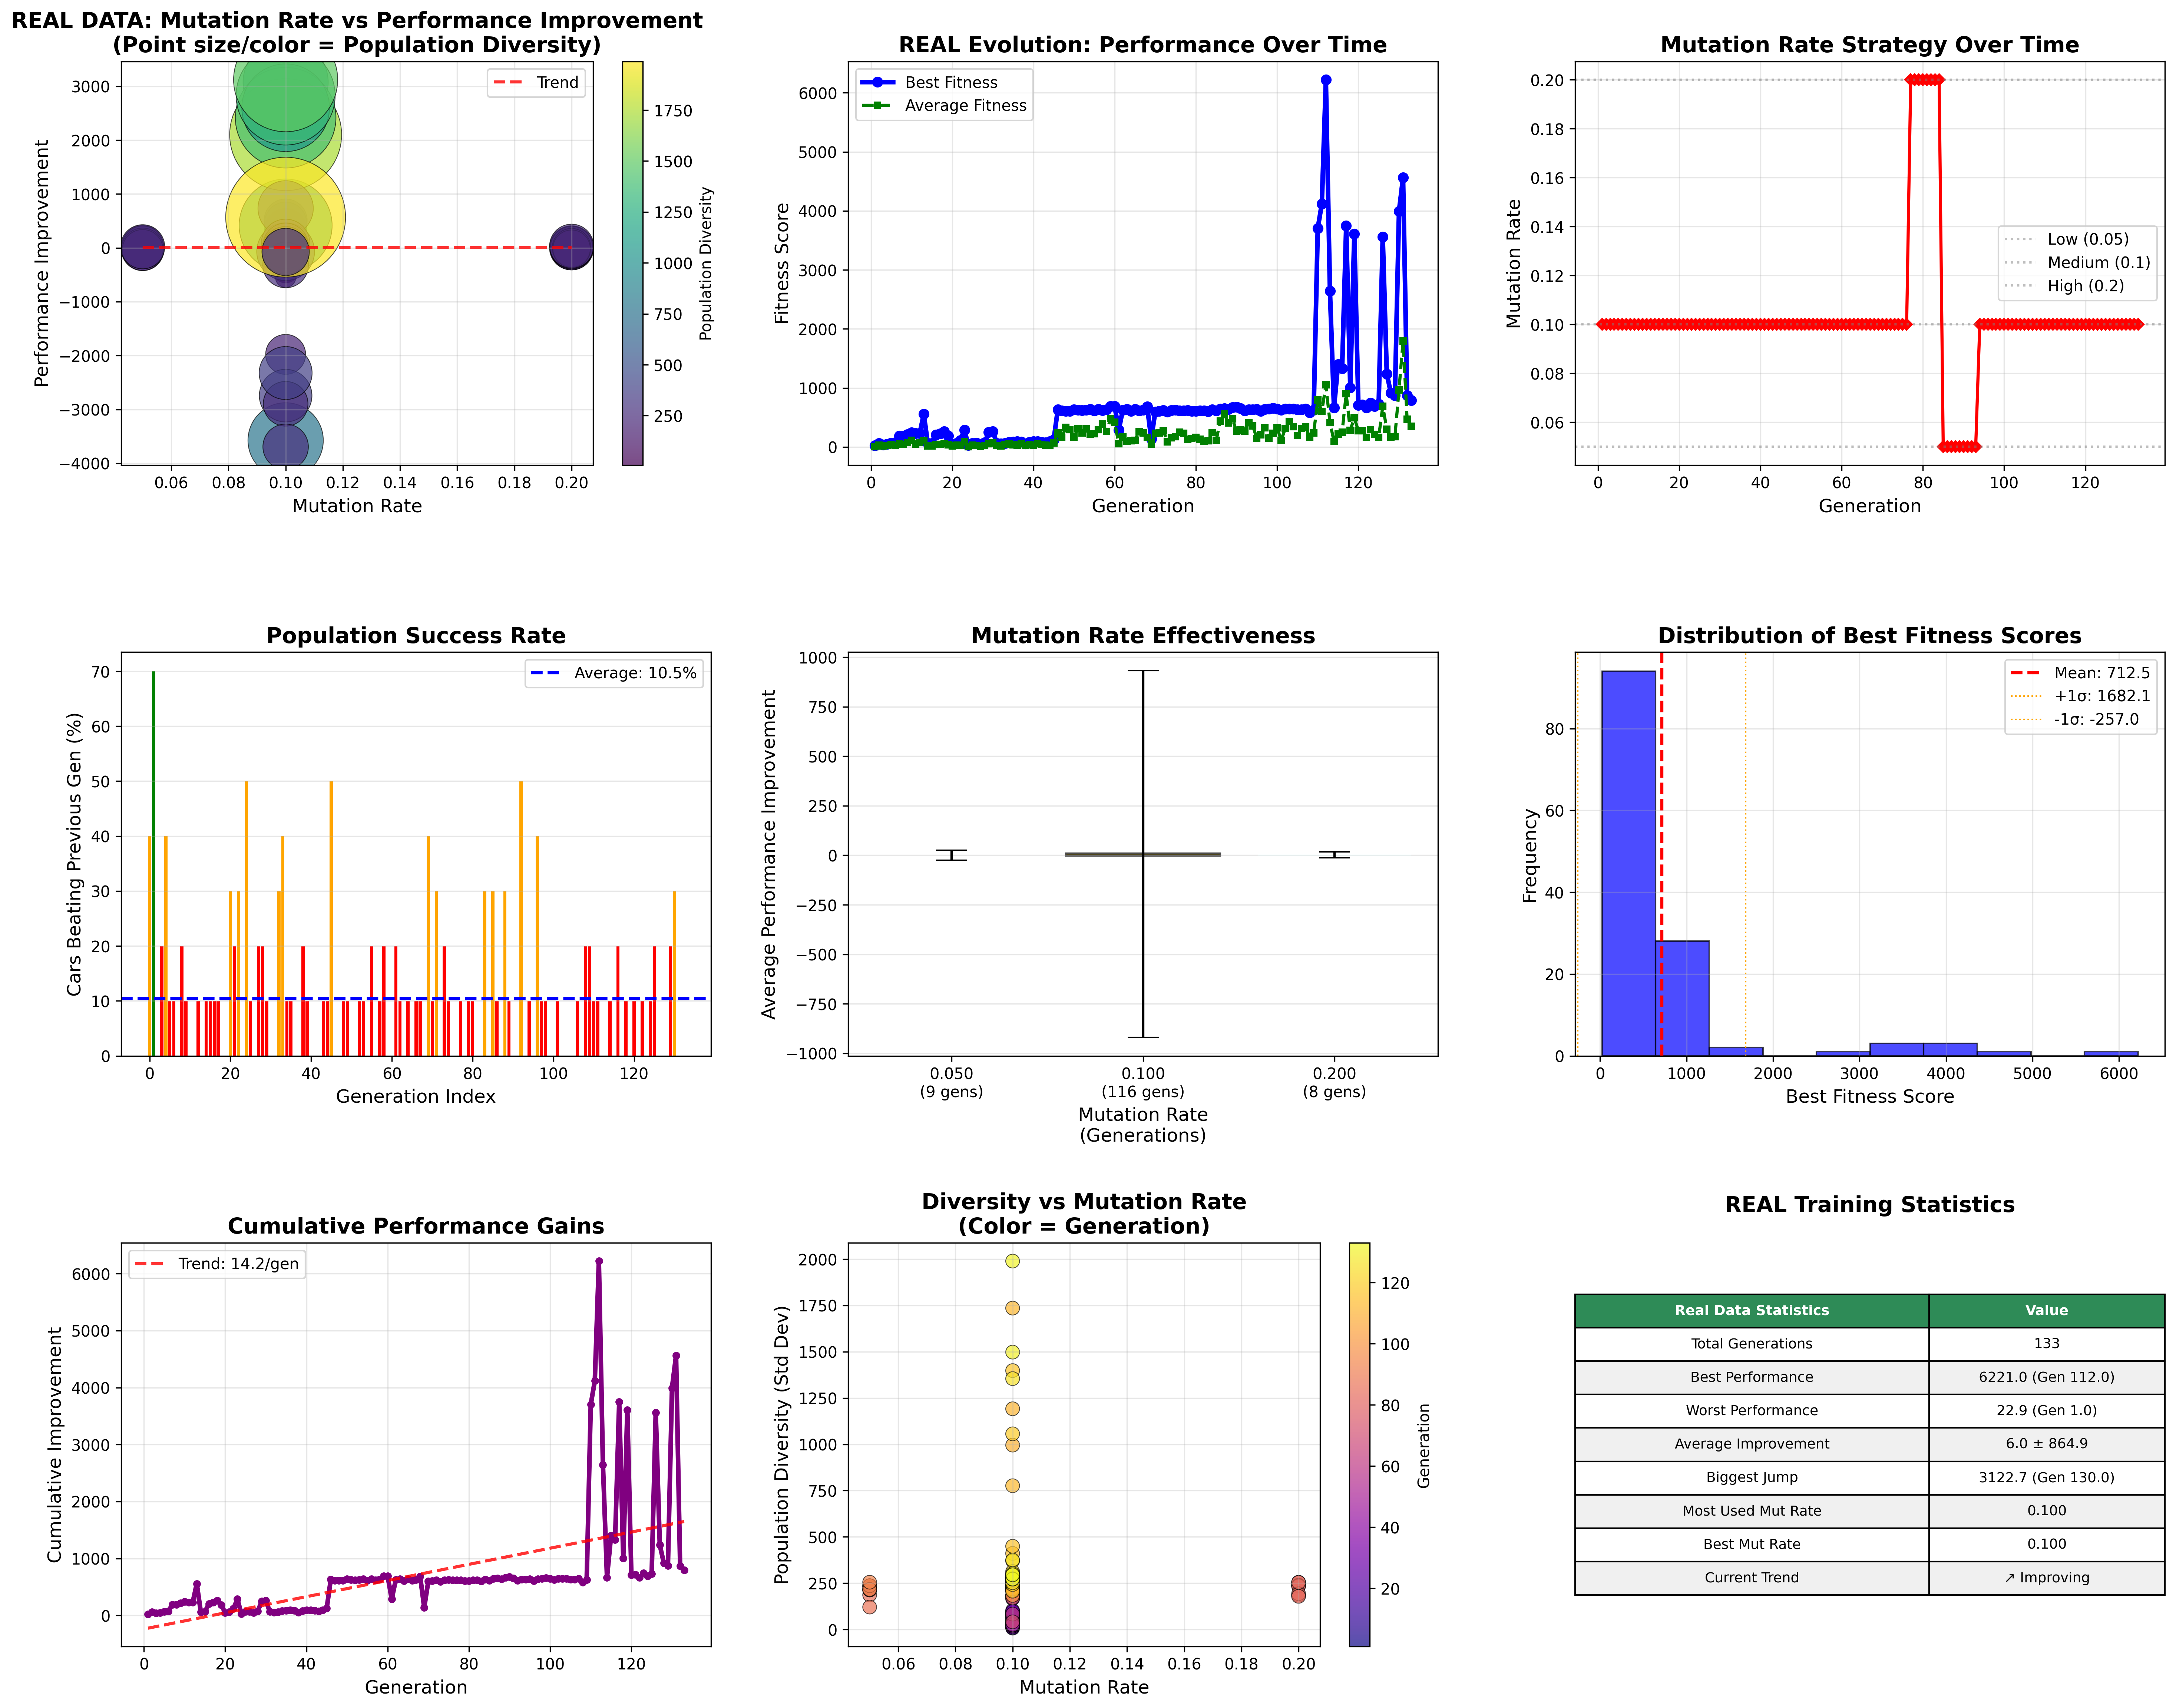
Analysis of how different mutation rates affected learning speed and final performance.
Sensor Importance Ranking
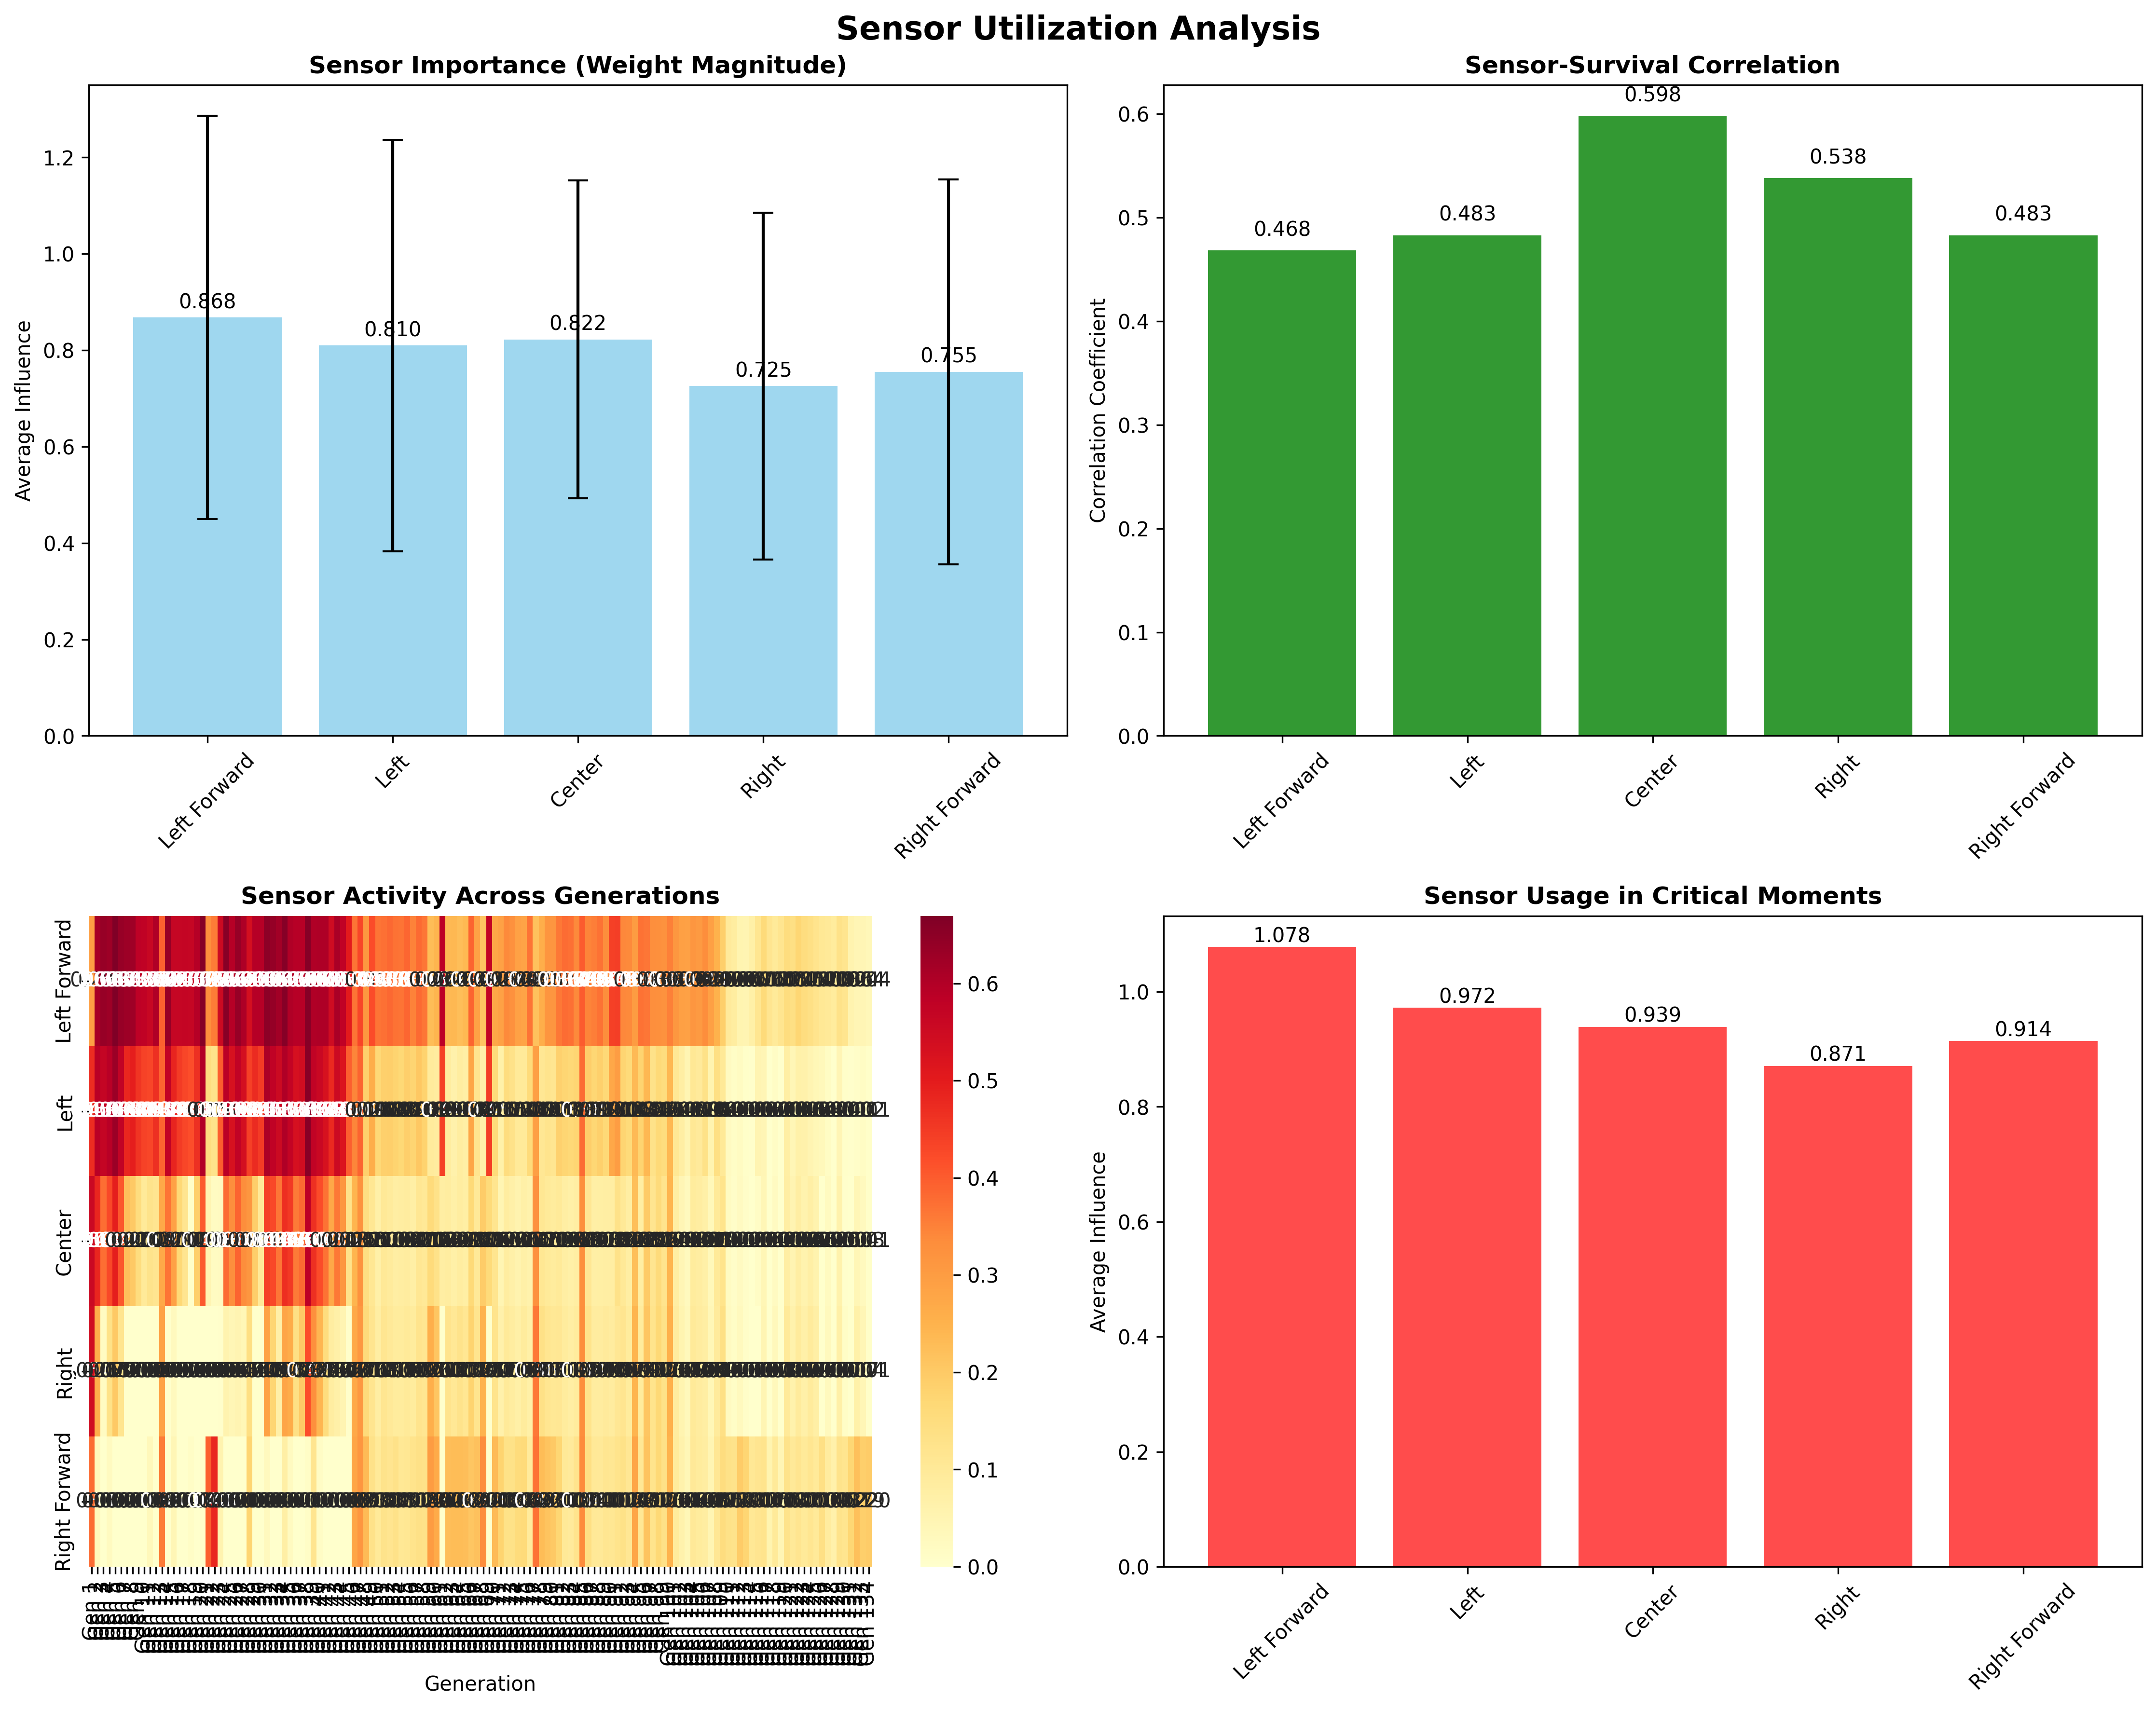
Which sensors the AI learned to prioritize for different driving situations and track sections.
Sensor Redundancy Analysis
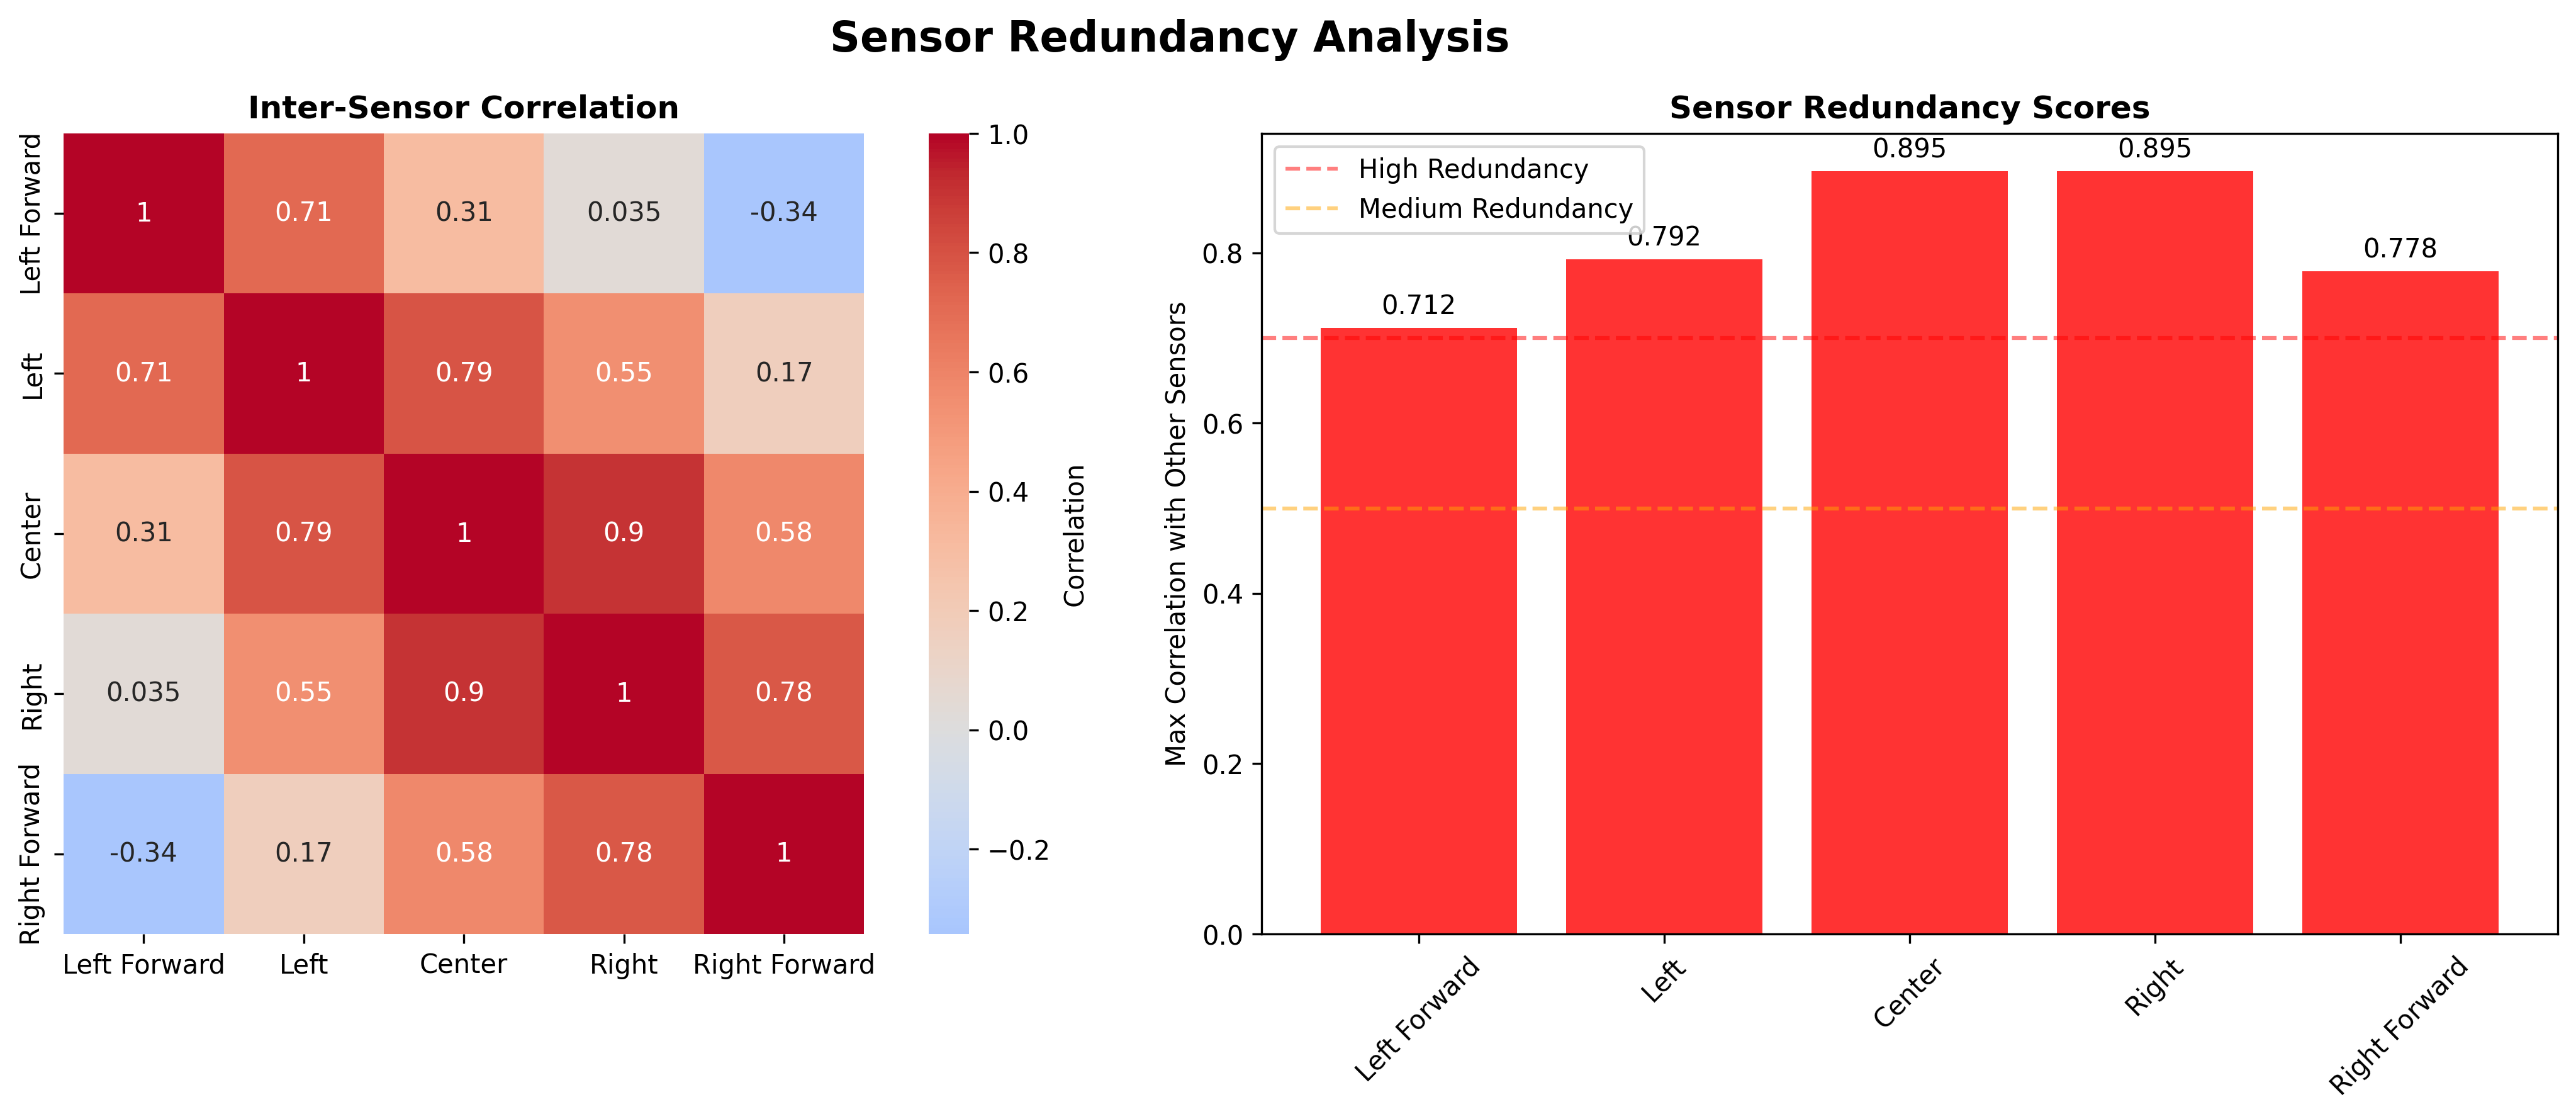
Analysis of sensor overlap and which inputs provide unique vs redundant information for driving decisions.
Sensor Redundancy Analysis
Analysis of sensor overlap and which inputs provide unique vs redundant information for driving decisions.
Ghost Racing Evolution
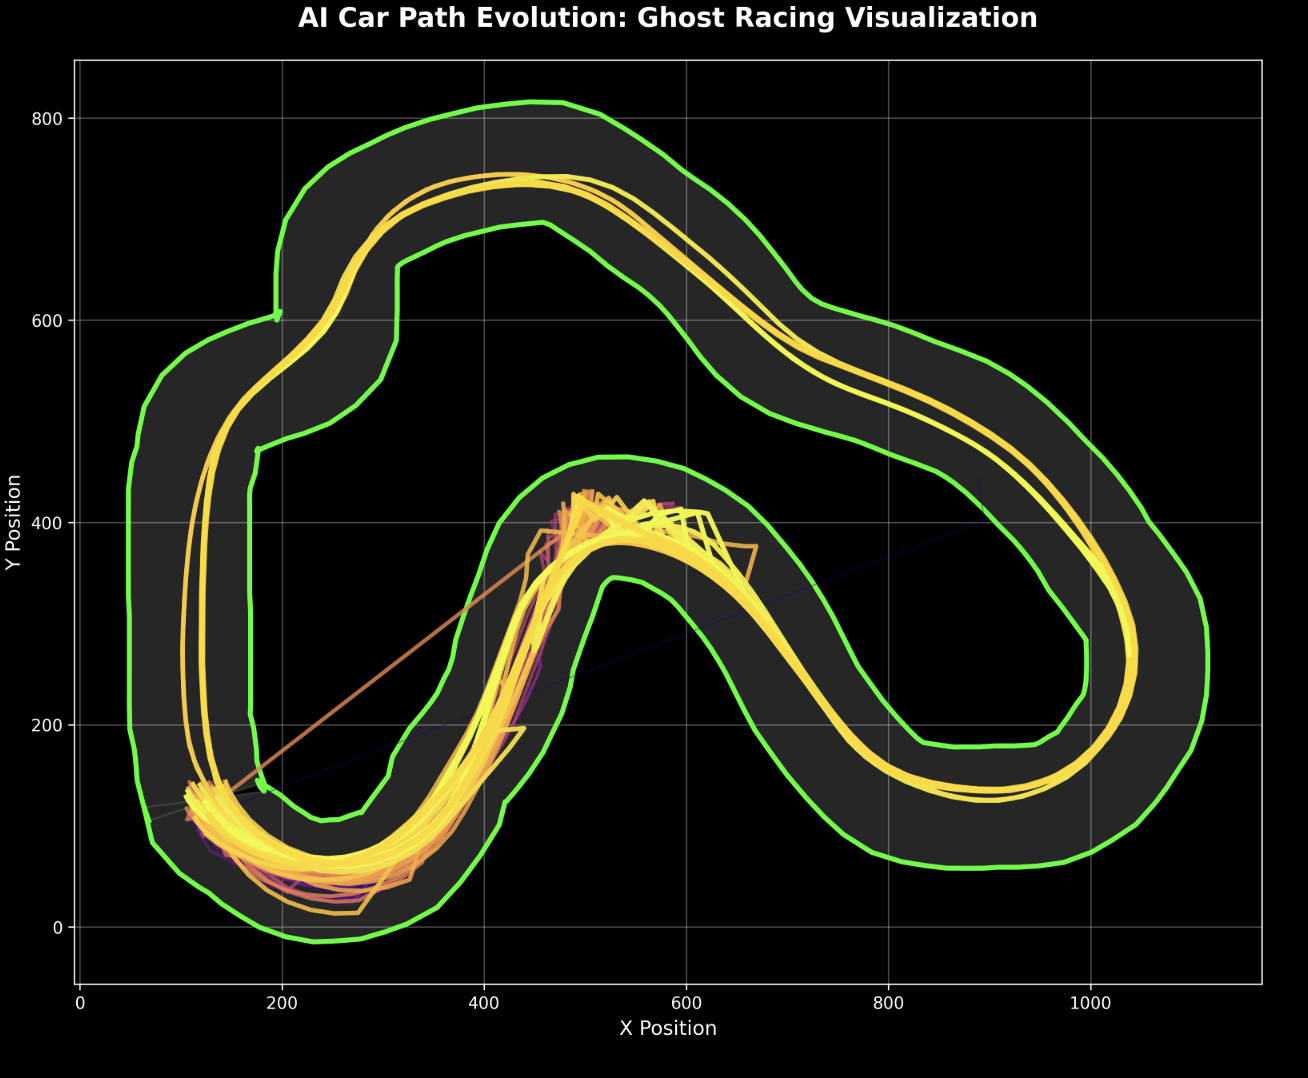
Overlay of racing lines from different generations, showing the evolution from chaotic paths to optimized racing lines.
Heat Trail Analysis
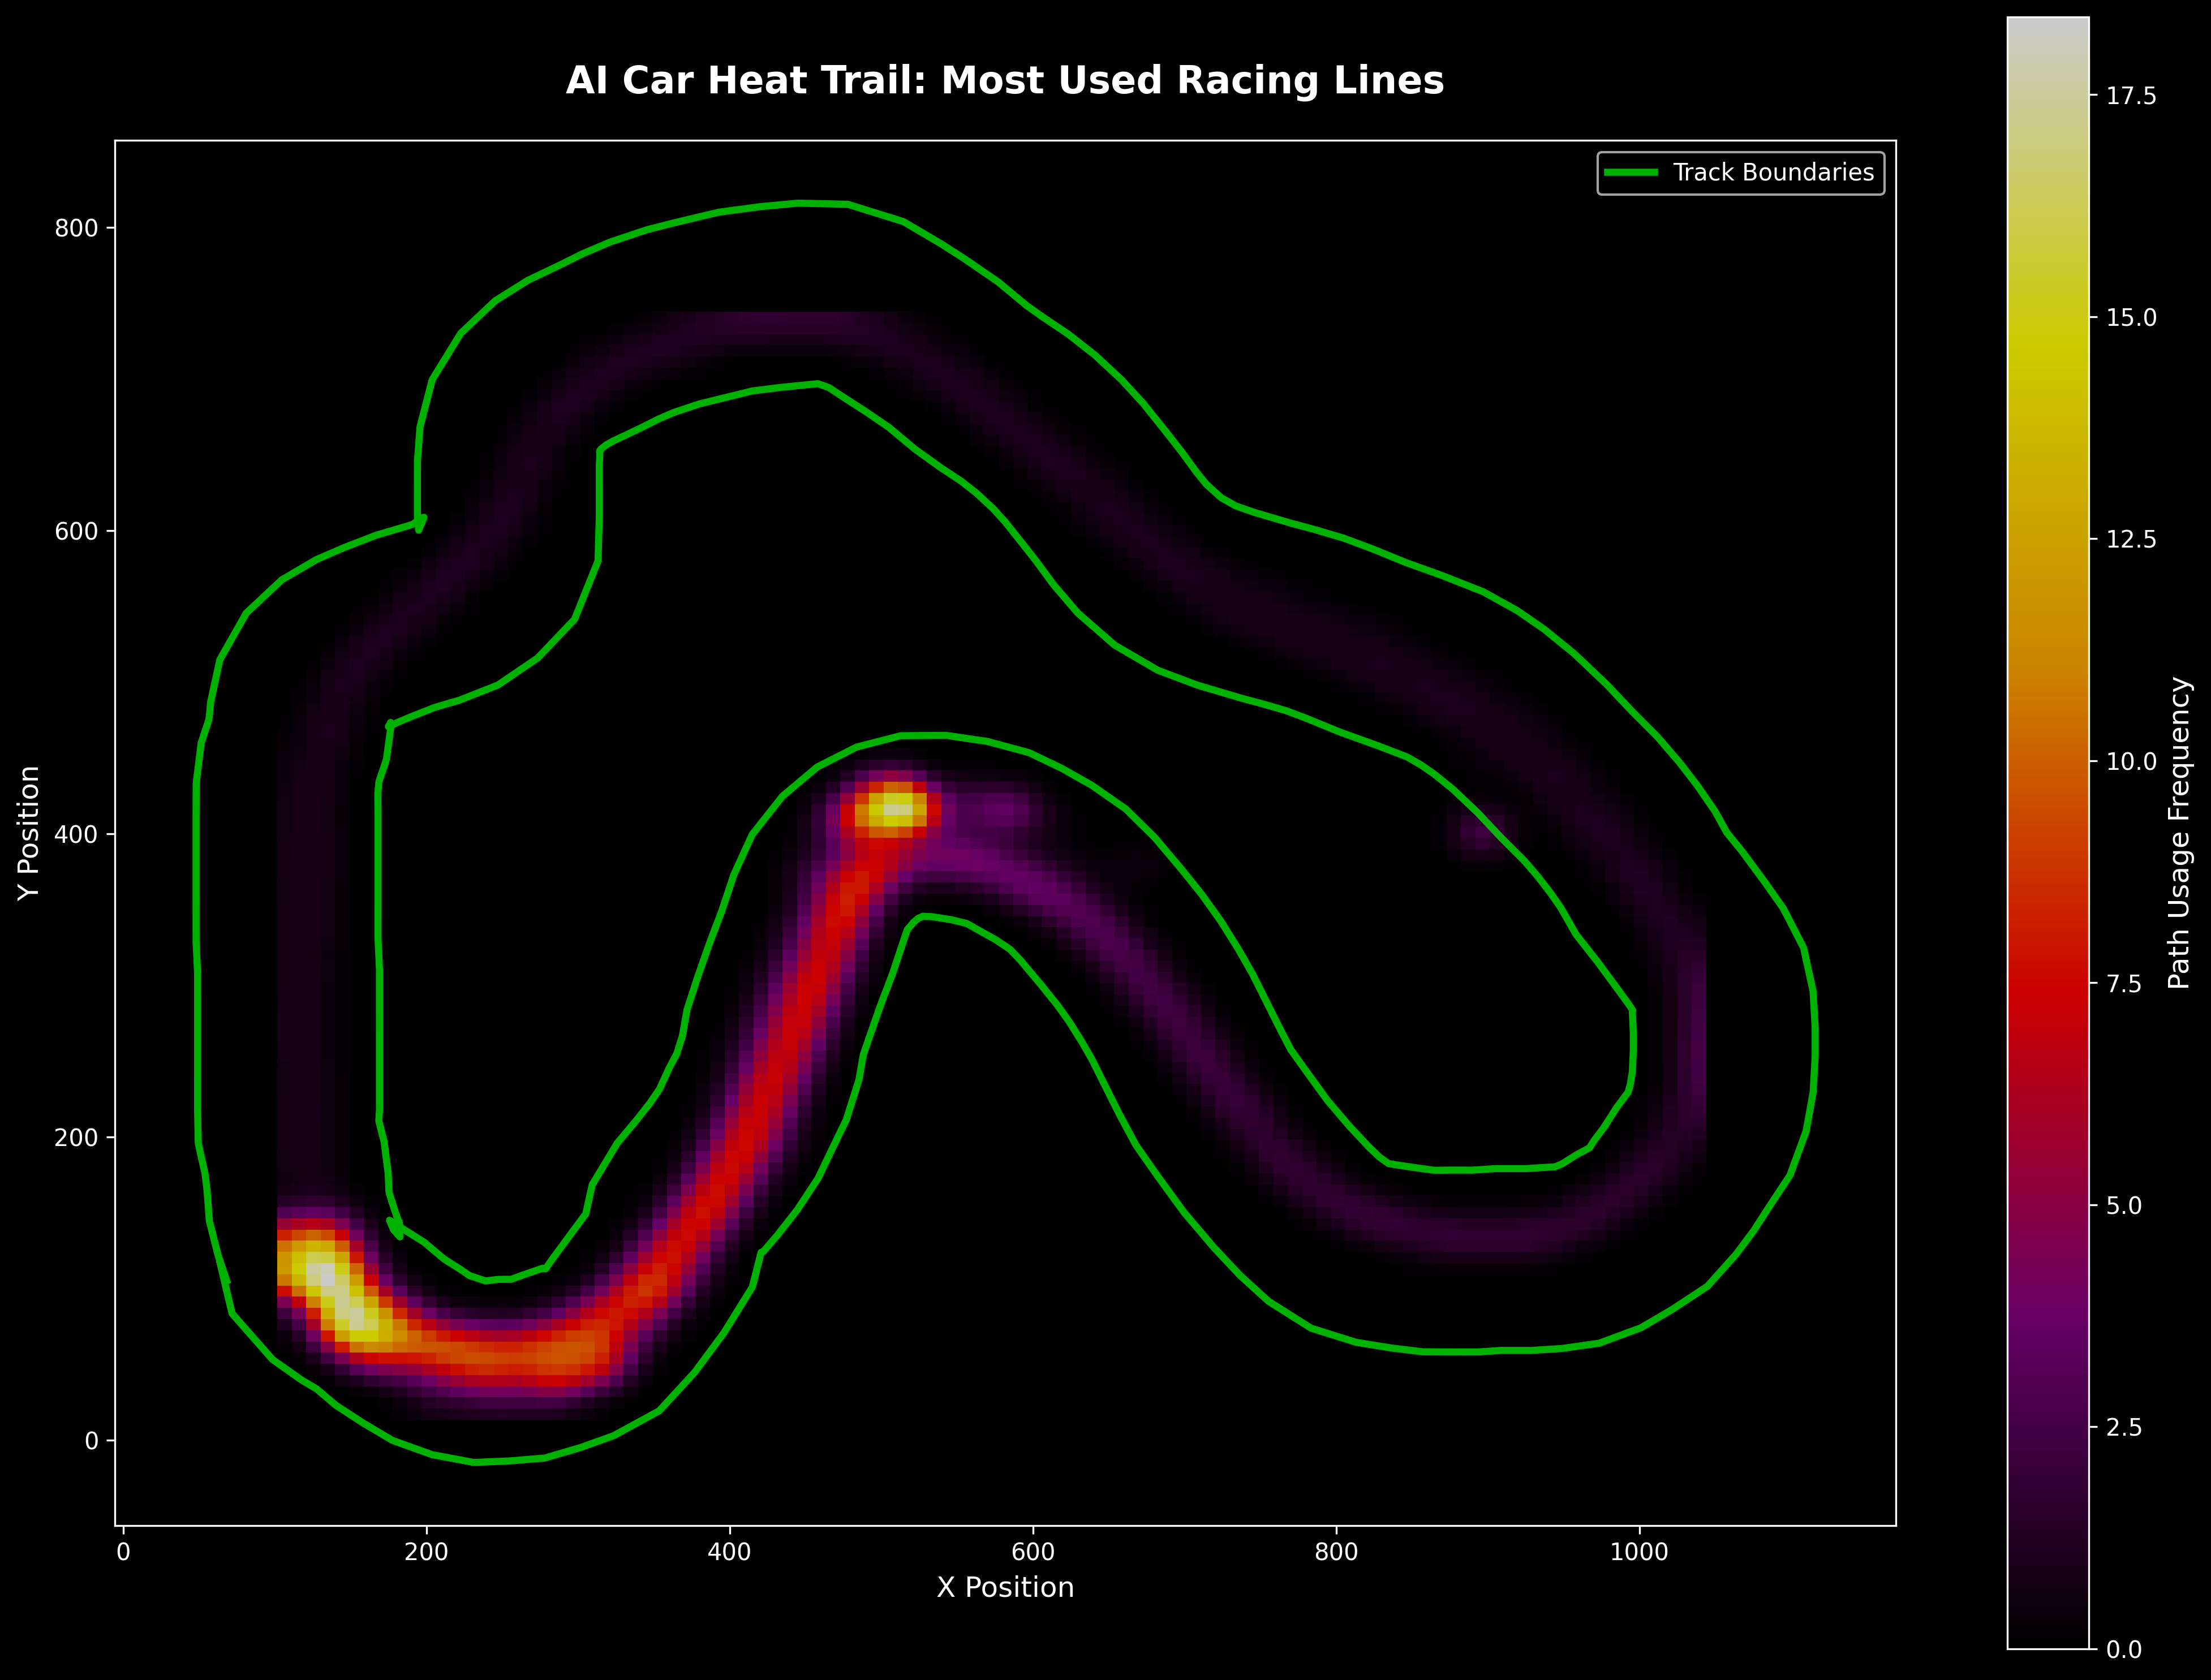
Heatmap showing the most frequently used racing lines, revealing the AI's preferred paths through the track.
Performance Overlay
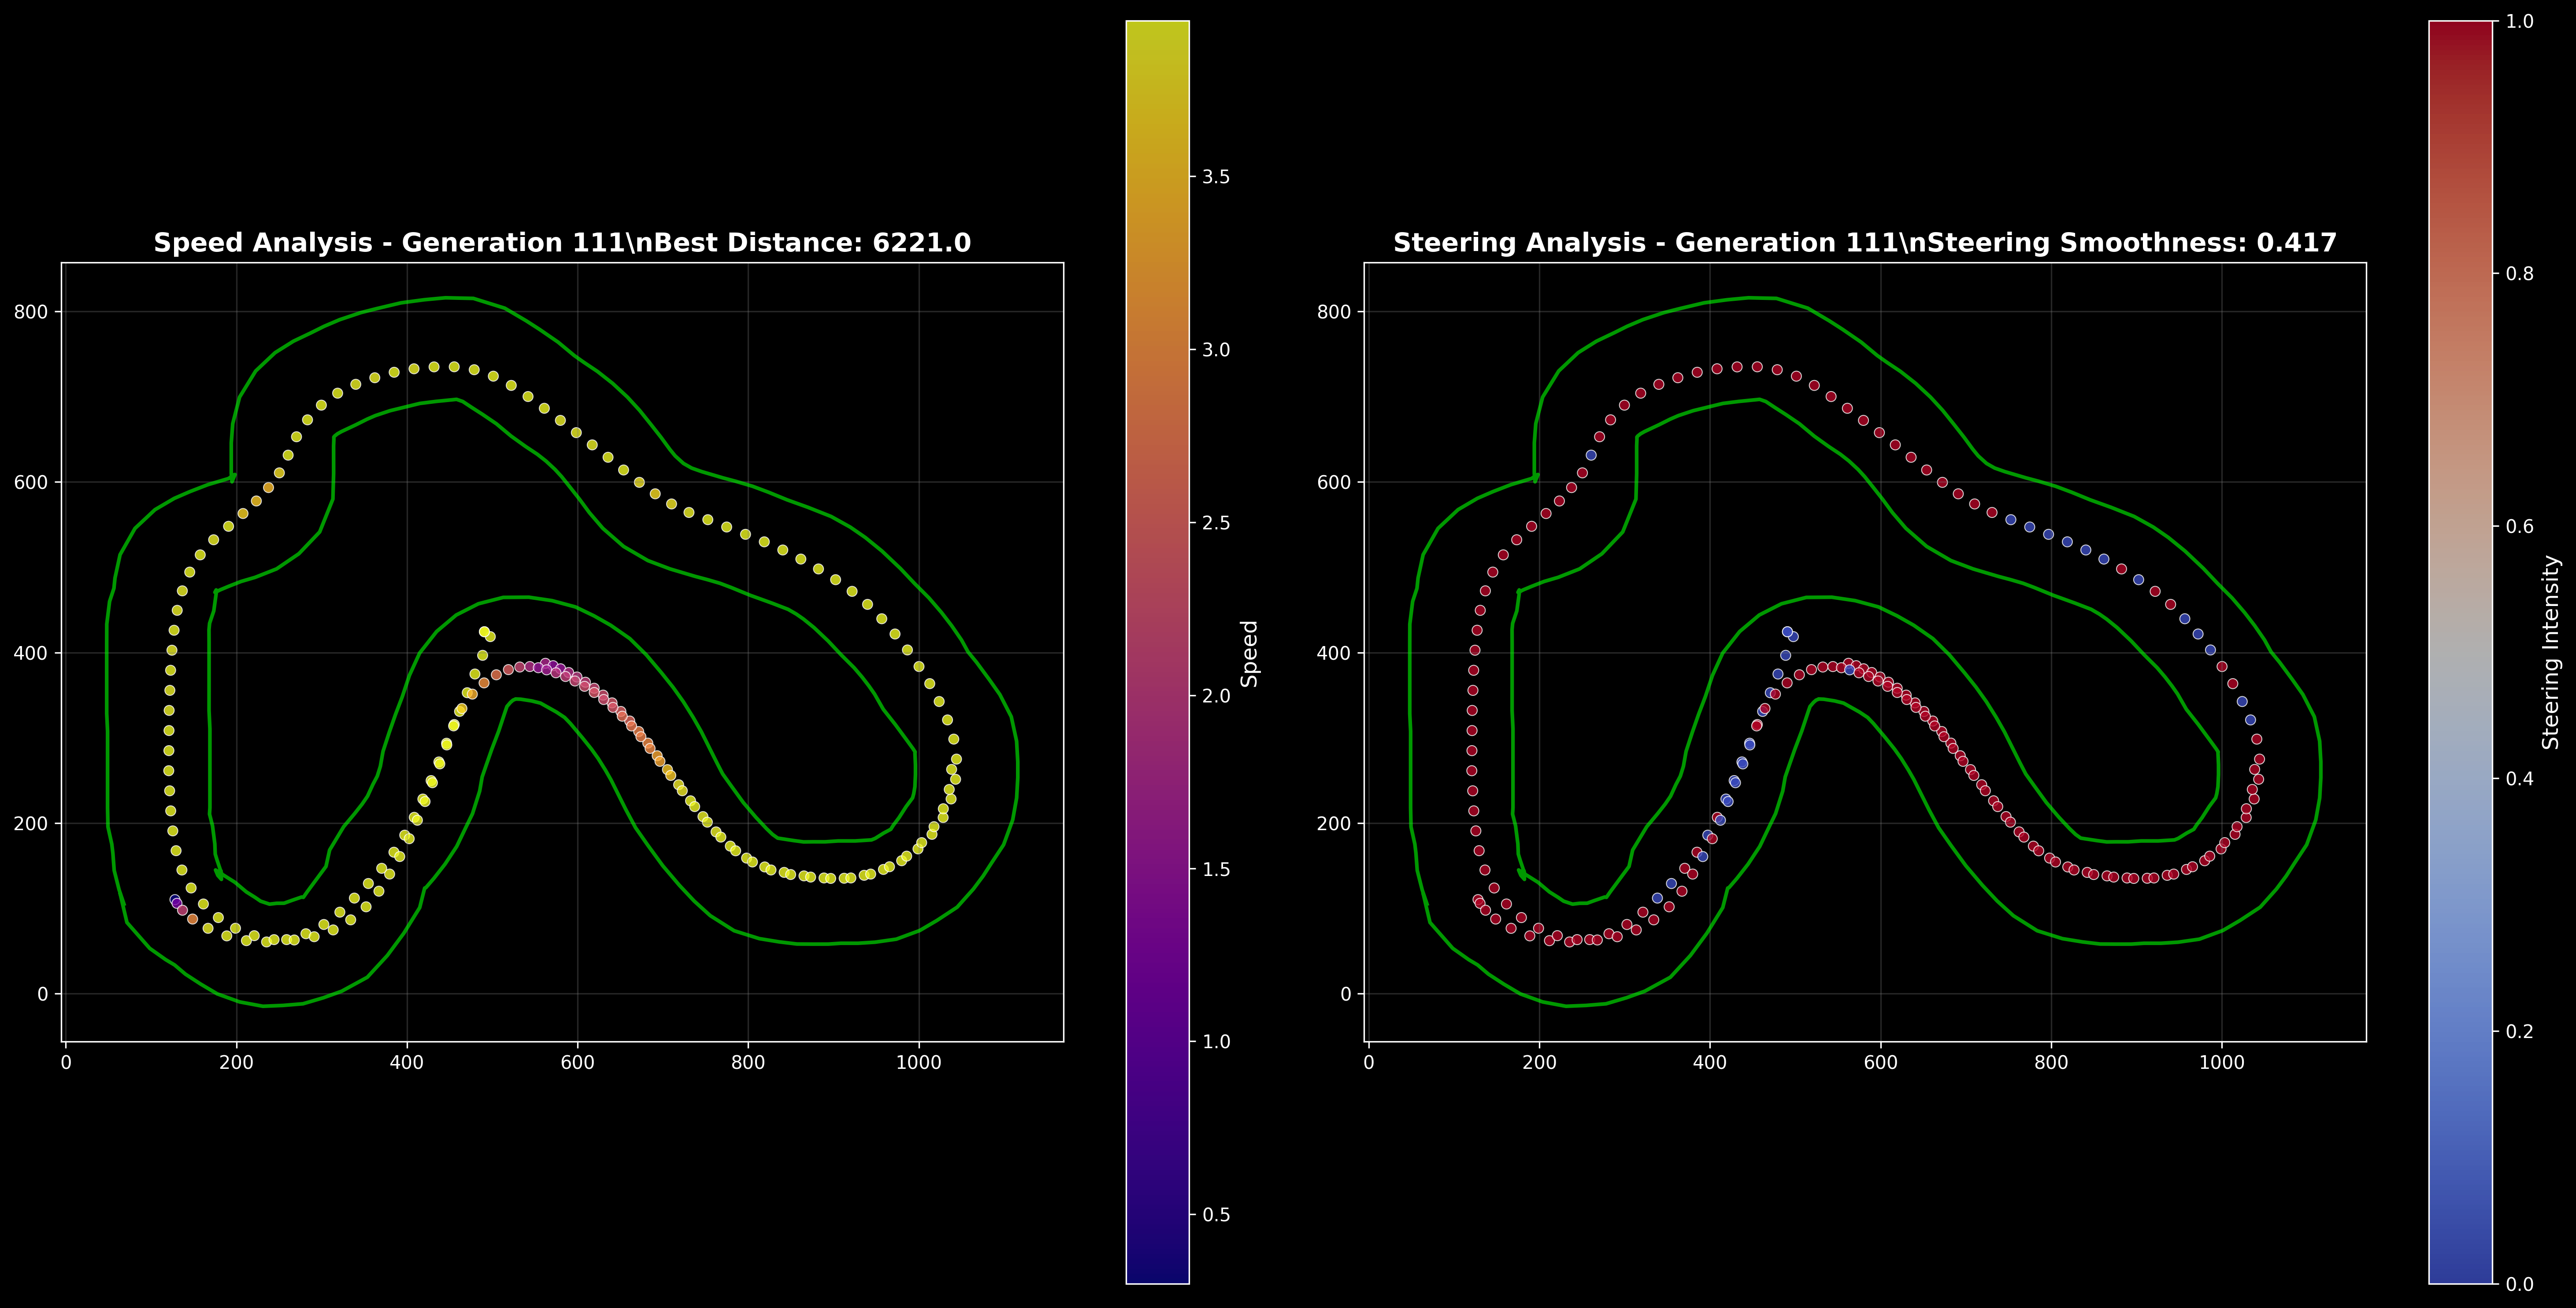
Speed and steering intensity overlaid on the racing line, showing where the AI brakes, accelerates, and turns.
Project Demo Video
Watch the project demonstration showcasing the AI car's training and racing capabilities in action.
Neural Network Visualization
Interactive visualization of the neural network structure and activation patterns during training.